Basic Stats
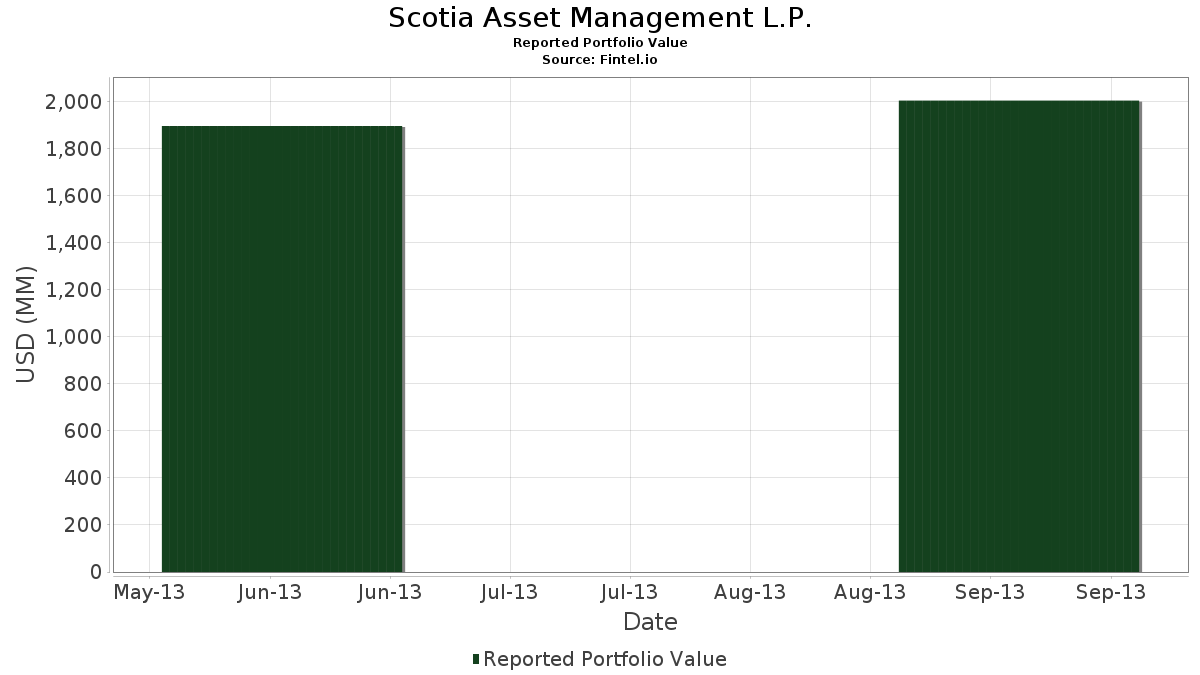
| Portfolio Value | $ 2,004,074,000 |
| Current Positions | 140 |
Latest Holdings, Performance, AUM (from 13F, 13D)
Scotia Asset Management L.P. has disclosed 140 total holdings in their latest SEC filings. Most recent portfolio value is calculated to be $ 2,004,074,000 USD. Actual Assets Under Management (AUM) is this value plus cash (which is not disclosed). Scotia Asset Management L.P.’s top holdings are The Toronto-Dominion Bank (US:TD) , Royal Bank of Canada (US:RY) , BCE Inc. (US:BCE) , Enbridge Inc. (US:ENB) , and TC Energy Corporation (US:TRP) . Scotia Asset Management L.P.’s new positions include (US:CTRX) , Aflac Incorporated (US:AFL) , Stanley Black & Decker, Inc. (US:SWK) , Agilent Technologies, Inc. (US:A) , and Franklin Resources, Inc. (US:BEN) .
Top Increases This Quarter
We use the change in the portfolio allocation because this is the most meaningful metric. Changes can be due to trades or changes in share prices.
| Security | Shares (MM) |
Value (MM$) |
Portfolio % | ΔPortfolio % |
|---|---|---|---|---|
| 2.24 | 201.84 | 10.0713 | 10.0713 | |
| 2.75 | 176.45 | 8.8044 | 8.8044 | |
| 2.53 | 108.26 | 5.4021 | 5.4021 | |
| 2.40 | 100.22 | 5.0008 | 5.0008 | |
| 2.24 | 98.60 | 4.9198 | 4.9198 | |
| 1.46 | 83.66 | 4.1745 | 4.1745 | |
| 0.82 | 82.92 | 4.1374 | 4.1374 | |
| 1.00 | 79.92 | 3.9879 | 3.9879 | |
| 2.11 | 75.55 | 3.7699 | 3.7699 | |
| 1.12 | 74.57 | 3.7208 | 3.7208 |
Top Decreases This Quarter
We use the change in the portfolio allocation because this is the most meaningful metric. Changes can be due to trades or changes in share prices.
| Security | Shares (MM) |
Value (MM$) |
Portfolio % | ΔPortfolio % |
|---|
13F and Fund Filings
This form was filed on 2013-11-14 for the reporting period 2013-09-30. Click the link icon to see the full transaction history.
Upgrade to unlock premium data and export to Excel ![]() .
.
| Security | Type | Avg Share Price | Shares (MM) |
ΔShares (%) |
ΔShares (%) |
Value ($MM) |
Portfolio (%) |
ΔPortfolio (%) |
|
|---|---|---|---|---|---|---|---|---|---|
| TD / The Toronto-Dominion Bank | 2.24 | 2.28 | 201.84 | 14.59 | 10.0713 | 10.0713 | |||
| RY / Royal Bank of Canada | 2.75 | 3.92 | 176.45 | 14.21 | 8.8044 | 8.8044 | |||
| BCE / BCE Inc. | 2.53 | -13.91 | 108.26 | -10.32 | 5.4021 | 5.4021 | |||
| ENB / Enbridge Inc. | 2.40 | 1.17 | 100.22 | 0.45 | 5.0008 | 5.0008 | |||
| TRP / TC Energy Corporation | 2.24 | -5.19 | 98.60 | -3.32 | 4.9198 | 4.9198 | |||
| BNS / The Bank of Nova Scotia | 1.46 | 9.14 | 83.66 | 16.87 | 4.1745 | 4.1745 | |||
| CNI / Canadian National Railway Company | 0.82 | 1.70 | 82.92 | 5.78 | 4.1374 | 4.1374 | |||
| CM / Canadian Imperial Bank of Commerce | 1.00 | -3.14 | 79.92 | 8.67 | 3.9879 | 3.9879 | |||
| SU / Suncor Energy Inc. | 2.11 | -8.50 | 75.55 | 10.93 | 3.7699 | 3.7699 | |||
| BMO / Bank of Montreal | 1.12 | 3.59 | 74.57 | 19.14 | 3.7208 | 3.7208 | |||
| RCI / Rogers Communications Inc. | 1.67 | 4.20 | 71.75 | 14.30 | 3.5802 | 3.5802 | |||
| TRI / Thomson Reuters Corporation | 1.59 | 4.03 | 55.52 | 11.42 | 2.7706 | 2.7706 | |||
| CVE / Cenovus Energy Inc. | 1.79 | 2.92 | 53.46 | 7.61 | 2.6676 | 2.6676 | |||
| TECK.B / Teck Resources Limited | 1.82 | 19.79 | 48.82 | 50.57 | 2.4362 | 2.4362 | |||
| SJRWF / Shaw Communications Inc. - Class A | 2.07 | 6.41 | 48.20 | 2.90 | 2.4053 | 2.4053 | |||
| MFC / HEXAOM | 2.66 | 12.38 | 44.03 | 16.10 | 2.1968 | 2.1968 | |||
| POT / Potash Corp. of Saskatchewan, Inc. | 1.09 | -21.90 | 34.06 | -36.02 | 1.6996 | 1.6996 | |||
| SLFYF / Sun Life Financial, Inc. - 4.75% PRF PERPETUAL CAD 25 - Cls A Ser 1 | 1.03 | 5.21 | 32.88 | 13.39 | 1.6407 | 1.6407 | |||
| MGA / Magna International Inc. | 0.40 | -12.84 | 32.76 | 0.93 | 1.6344 | 1.6344 | |||
| GG / Goldcorp, Inc. | 1.18 | 2.13 | 30.66 | 6.94 | 1.5301 | 1.5301 | |||
| ECA / EnCana Corp. | 1.56 | -4.10 | 26.98 | -2.09 | 1.3461 | 1.3461 | |||
| CNQ / Canadian Natural Resources Limited | 0.83 | -16.63 | 26.25 | -7.12 | 1.3096 | 1.3096 | |||
| TU / TELUS Corporation | 0.78 | 10.85 | 26.03 | 25.81 | 1.2987 | 1.2987 | |||
| VET / Vermilion Energy Inc. | 0.42 | -18.71 | 23.21 | -8.64 | 1.1584 | 1.1584 | |||
| BAMH / Brookfield Finance Inc - 4.625% NT REDEEM 16/10/2080 USD 25 | 0.60 | 2.44 | 22.43 | 6.57 | 1.1191 | 1.1191 | |||
| GLD / SPDR Gold Trust | 0.17 | -5.64 | 21.56 | 1.56 | 1.0756 | 1.0756 | |||
| GE / General Electric Company | 0.66 | 8.63 | 15.76 | 11.92 | 0.7863 | 0.7863 | |||
| JNJ / Johnson & Johnson | 0.18 | -1.33 | 15.45 | -0.35 | 0.7708 | 0.7708 | |||
| PFE / Pfizer Inc. | 0.45 | 7.68 | 12.92 | 10.45 | 0.6445 | 0.6445 | |||
| AGU / Agrium Inc. | 0.14 | 5.55 | 11.74 | 2.26 | 0.5860 | 0.5860 | |||
| IMO / Imperial Oil Limited | 0.26 | -7.25 | 11.21 | 6.62 | 0.5593 | 0.5593 | |||
| THI / Tim Hortons, Inc. | 0.18 | -31.34 | 10.38 | -26.42 | 0.5177 | 0.5177 | |||
| PG / The Procter & Gamble Company | 0.13 | 11.58 | 9.52 | 9.57 | 0.4751 | 0.4751 | |||
| WFC / Wells Fargo & Company | 0.21 | 9.15 | 8.54 | 9.29 | 0.4260 | 0.4260 | |||
| 91911K102 / Bausch Health Companies | 0.08 | -4.36 | 8.48 | 15.58 | 0.4230 | 0.4230 | |||
| MCD / McDonald's Corporation | 0.09 | 14.85 | 8.24 | 11.63 | 0.4113 | 0.4113 | |||
| IBM / International Business Machines Corporation | 0.04 | 5.53 | 7.73 | 2.28 | 0.3857 | 0.3857 | |||
| PEP / PepsiCo, Inc. | 0.09 | 1.61 | 7.19 | -1.22 | 0.3587 | 0.3587 | |||
| SPY / SPDR S&P 500 ETF | 0.04 | -0.41 | 7.02 | 4.31 | 0.3501 | 0.3501 | |||
| TLM / | 0.58 | -15.45 | 6.68 | -15.02 | 0.3333 | 0.3333 | |||
| MSFT / Microsoft Corporation | 0.20 | -2.04 | 6.59 | -5.49 | 0.3288 | 0.3288 | |||
| GOLD / Barrick Mining Corporation | 0.35 | -60.75 | 6.58 | -53.72 | 0.3281 | 0.3281 | |||
| JPM / JPMorgan Chase & Co. | 0.12 | 12.60 | 5.98 | 10.27 | 0.2984 | 0.2984 | |||
| DOV / Dover Corporation | 0.07 | -0.91 | 5.86 | 14.65 | 0.2922 | 0.2922 | |||
| PM / Philip Morris International Inc. | 0.06 | 26.80 | 5.09 | 26.76 | 0.2538 | 0.2538 | |||
| VFC / V.F. Corporation | 0.03 | 8.55 | 5.07 | 11.94 | 0.2531 | 0.2531 | |||
| VZ / Verizon Communications Inc. | 0.11 | 9.44 | 5.00 | 1.50 | 0.2495 | 0.2495 | |||
| XOM / Exxon Mobil Corporation | 0.06 | 6.21 | 4.79 | 1.16 | 0.2388 | 0.2388 | |||
| 07317Q956 / Baytex Energy Trust | 0.11 | 1.06 | 4.69 | 15.67 | 0.2342 | 0.2342 | |||
| CTRX / | 0.09 | 4.19 | 0.2093 | 0.2093 | |||||
| ADP / Automatic Data Processing, Inc. | 0.06 | 1.87 | 4.05 | 7.11 | 0.2023 | 0.2023 | |||
| TGT / Target Corporation | 0.06 | 8.39 | 4.01 | 0.73 | 0.2003 | 0.2003 | |||
| AAPL / Apple Inc. | 0.01 | 11.95 | 3.84 | 34.79 | 0.1914 | 0.1914 | |||
| CSCO / Cisco Systems, Inc. | 0.16 | 1.03 | 3.75 | -2.67 | 0.1871 | 0.1871 | |||
| CP / Canadian Pacific Kansas City Limited | 0.03 | -0.05 | 3.69 | 1.60 | 0.1842 | 0.1842 | |||
| FNV / Franco-Nevada Corporation | 0.08 | 0.18 | 3.64 | 26.87 | 0.1814 | 0.1814 | |||
| ABBV / AbbVie Inc. | 0.08 | 11.77 | 3.63 | 20.93 | 0.1813 | 0.1813 | |||
| HON / Honeywell International Inc. | 0.04 | -6.72 | 3.62 | -2.35 | 0.1808 | 0.1808 | |||
| C / Citigroup Inc. | 0.07 | 23.90 | 3.47 | 25.34 | 0.1730 | 0.1730 | |||
| 74005P104 / Praxair, Inc. | 0.03 | 0.36 | 3.15 | 4.78 | 0.1574 | 0.1574 | |||
| GIB / CGI Inc. | 0.09 | 8.42 | 3.12 | 29.85 | 0.1554 | 0.1554 | |||
| CB / Chubb Limited | 0.03 | 15.18 | 3.10 | 21.48 | 0.1549 | 0.1549 | |||
| CVS / CVS Health Corporation | 0.05 | -8.51 | 3.09 | -9.17 | 0.1541 | 0.1541 | |||
| YRI / Yamana Gold Inc | 0.29 | -2.34 | 3.07 | 6.41 | 0.1531 | 0.1531 | |||
| QCOM / QUALCOMM Incorporated | 0.04 | 4.23 | 3.00 | 14.96 | 0.1495 | 0.1495 | |||
| MRK / Merck & Co., Inc. | 0.06 | 44.21 | 2.97 | 47.83 | 0.1480 | 0.1480 | |||
| BDX / Becton, Dickinson and Company | 0.03 | 0.75 | 2.94 | 2.01 | 0.1468 | 0.1468 | |||
| GOOGL / Alphabet Inc. | 0.00 | 15.06 | 2.92 | 14.51 | 0.1457 | 0.1457 | |||
| PAYX / Paychex, Inc. | 0.07 | -2.41 | 2.80 | 8.62 | 0.1396 | 0.1396 | |||
| USB / U.S. Bancorp | 0.07 | 9.62 | 2.71 | 10.92 | 0.1354 | 0.1354 | |||
| MMM / 3M Company | 0.02 | 2.58 | 2.62 | 12.03 | 0.1306 | 0.1306 | |||
| DOW / Dow Inc. | 0.04 | 61.69 | 2.39 | 80.38 | 0.1193 | 0.0494 | |||
| VIAB / Viacom, Inc. | 0.03 | 9.22 | 2.35 | 34.21 | 0.1171 | 0.1171 | |||
| BAC / Bank of America Corporation | 0.17 | -22.94 | 2.28 | -17.28 | 0.1139 | 0.1139 | |||
| FDO / | 0.03 | 10.45 | 2.21 | 27.66 | 0.1101 | 0.1101 | |||
| ORCL / Oracle Corporation | 0.07 | 15.39 | 2.20 | 24.62 | 0.1096 | 0.1096 | |||
| WMT / Walmart Inc. | 0.03 | 23.57 | 2.09 | 22.72 | 0.1043 | 0.1043 | |||
| CCJ / Cameco Corporation | 0.11 | -15.91 | 2.00 | -26.53 | 0.0996 | 0.0996 | |||
| ABT / Abbott Laboratories | 0.06 | 769.13 | 1.89 | 727.07 | 0.0945 | 0.0945 | |||
| OXY / Occidental Petroleum Corporation | 0.02 | 3.64 | 1.82 | 8.66 | 0.0908 | 0.0908 | |||
| BPR / Brookfield Property REIT Inc. | 0.09 | -9.03 | 1.80 | -12.83 | 0.0899 | 0.0899 | |||
| COP / ConocoPhillips | 0.02 | -3.77 | 1.68 | 10.56 | 0.0836 | 0.0836 | |||
| CVX / Chevron Corporation | 0.01 | 4.44 | 1.57 | 7.24 | 0.0783 | 0.0783 | |||
| CMCSA / Comcast Corporation | 0.03 | 54.70 | 1.49 | 66.85 | 0.0743 | 0.0743 | |||
| UNP / Union Pacific Corporation | 0.01 | 10.22 | 1.46 | 10.93 | 0.0730 | 0.0730 | |||
| DHR / Danaher Corporation | 0.02 | 7.39 | 1.46 | 17.65 | 0.0729 | 0.0729 | |||
| HD / The Home Depot, Inc. | 0.02 | -1.78 | 1.40 | -3.77 | 0.0700 | 0.0700 | |||
| AFL / Aflac Incorporated | 0.02 | 1.39 | 0.0696 | 0.0696 | |||||
| MDT / Medtronic plc | 0.03 | -4.32 | 1.39 | -0.99 | 0.0696 | 0.0696 | |||
| CL / Colgate-Palmolive Company | 0.02 | -2.94 | 1.35 | 0.45 | 0.0673 | 0.0673 | |||
| CAE / CAE Inc. | 0.12 | -0.01 | 1.28 | 5.51 | 0.0640 | 0.0640 | |||
| PPL / Pembina Pipeline Corporation | 0.04 | -91.49 | 1.23 | -90.79 | 0.0613 | 0.0613 | |||
| CINF / Cincinnati Financial Corporation | 0.02 | 22.75 | 1.09 | 26.15 | 0.0546 | 0.0546 | |||
| 112823109 / Brookfield Canada Office Properties | 0.04 | 0.00 | 1.04 | 2.88 | 0.0517 | 0.0517 | |||
| SWK / Stanley Black & Decker, Inc. | 0.01 | 1.02 | 0.0507 | 0.0507 | |||||
| T / AT&T Inc. | 0.03 | 5.44 | 0.95 | 0.74 | 0.0475 | 0.0475 | |||
| AEM / Agnico Eagle Mines Limited | 0.03 | -77.31 | 0.92 | -78.23 | 0.0461 | 0.0461 | |||
| CAH / Cardinal Health, Inc. | 0.02 | -44.24 | 0.90 | -38.36 | 0.0451 | 0.0451 | |||
| A / Agilent Technologies, Inc. | 0.02 | 0.86 | 0.0431 | 0.0431 | |||||
| AXXDF / Alderon Iron Ore Corp. | 0.56 | 21.74 | 0.83 | 90.18 | 0.0416 | 0.0416 | |||
| KMB / Kimberly-Clark Corporation | 0.01 | -4.32 | 0.77 | -7.21 | 0.0385 | 0.0385 | |||
| SDY / SPDR Series Trust - SPDR S&P Dividend ETF | 0.01 | 5.27 | 0.74 | 9.43 | 0.0371 | 0.0371 | |||
| TAC / TransAlta Corporation | 0.05 | 5.31 | 0.70 | -0.29 | 0.0348 | 0.0348 | |||
| BWA / BorgWarner Inc. | 0.01 | 0.00 | 0.68 | 17.65 | 0.0339 | 0.0339 | |||
| GM / General Motors Company | 0.02 | 0.00 | 0.63 | 8.09 | 0.0313 | 0.0313 | |||
| PPG / PPG Industries, Inc. | 0.00 | -27.47 | 0.63 | -17.26 | 0.0313 | 0.0313 | |||
| EMR / Emerson Electric Co. | 0.01 | 5.32 | 0.62 | 24.95 | 0.0310 | 0.0310 | |||
| F / Ford Motor Company | 0.04 | 1.33 | 0.61 | 10.47 | 0.0305 | 0.0305 | |||
| LYB / LyondellBasell Industries N.V. | 0.01 | 0.00 | 0.60 | 10.54 | 0.0298 | 0.0298 | |||
| MO / Altria Group, Inc. | 0.02 | 3.03 | 0.58 | 1.05 | 0.0289 | 0.0289 | |||
| MAS / Masco Corporation | 0.03 | 0.00 | 0.58 | 9.25 | 0.0289 | 0.0289 | |||
| SLB / Schlumberger Limited | 0.01 | -18.00 | 0.52 | 1.18 | 0.0257 | 0.0257 | |||
| TXT / Textron Inc. | 0.02 | 0.00 | 0.48 | 5.99 | 0.0239 | 0.0239 | |||
| APD / Air Products and Chemicals, Inc. | 0.00 | -44.46 | 0.46 | -35.31 | 0.0229 | 0.0229 | |||
| SPG / Simon Property Group, Inc. | 0.00 | 0.00 | 0.45 | -6.12 | 0.0222 | 0.0222 | |||
| C.WSA / Citigroup, Inc. | 0.00 | -25.19 | 0.42 | -21.30 | 0.0212 | 0.0212 | |||
| PGF / Invesco Exchange-Traded Fund Trust - Invesco Financial Preferred ETF | 0.07 | -15.56 | 0.39 | 1.05 | 0.0193 | 0.0193 | |||
| KO / The Coca-Cola Company | 0.01 | 2.90 | 0.36 | -2.68 | 0.0181 | 0.0181 | |||
| GRP.U / Granite Real Estate Investment Trust | 0.01 | -4.50 | 0.36 | -0.55 | 0.0181 | 0.0181 | |||
| ADM / Archer-Daniels-Midland Company | 0.01 | 56.88 | 0.35 | 70.67 | 0.0177 | 0.0177 | |||
| ACN / Accenture plc | 0.00 | -14.80 | 0.35 | -12.78 | 0.0177 | 0.0177 | |||
| BRK.A / Berkshire Hathaway Inc. | 0.00 | 0.00 | 0.34 | 1.19 | 0.0170 | 0.0170 | |||
| SIAL / Sigma-Aldrich Corporation | 0.00 | -8.45 | 0.34 | -2.60 | 0.0168 | 0.0168 | |||
| BEN / Franklin Resources, Inc. | 0.01 | 0.33 | 0.0166 | 0.0166 | |||||
| BRK.B / Berkshire Hathaway Inc. | 0.00 | 7.13 | 0.31 | 8.48 | 0.0153 | 0.0153 | |||
| DIS / The Walt Disney Company | 0.00 | -13.60 | 0.31 | -11.78 | 0.0153 | 0.0153 | |||
| EFA / iShares Trust - iShares MSCI EAFE ETF | 0.00 | -68.96 | 0.29 | -65.43 | 0.0144 | 0.0144 | |||
| MET / MetLife, Inc. | 0.01 | -15.29 | 0.26 | -13.09 | 0.0129 | 0.0129 | |||
| ESRX / Express Scripts Holding Co. | 0.00 | -50.03 | 0.23 | -50.00 | 0.0113 | 0.0113 | |||
| TAHO / Tahoe Resources Inc. | 0.01 | -1.01 | 0.22 | 26.14 | 0.0111 | 0.0111 | |||
| ITW / Illinois Tool Works Inc. | 0.00 | -10.73 | 0.22 | -1.35 | 0.0110 | 0.0110 | |||
| NSC / Norfolk Southern Corporation | 0.00 | -8.23 | 0.22 | -2.24 | 0.0109 | 0.0109 | |||
| META / Meta Platforms, Inc. | 0.00 | 0.21 | 0.0104 | 0.0104 | |||||
| J / Jacobs Solutions Inc. | 0.00 | 0.20 | 0.0102 | 0.0102 | |||||
| WAG / | 0.00 | 0.20 | 0.0101 | 0.0101 | |||||
| NOK / Nokia Oyj - Depositary Receipt (Common Stock) | 0.02 | 0.02 | 0.15 | 73.26 | 0.0074 | 0.0029 | |||
| BB / BlackBerry Limited | 0.02 | -24.61 | 0.14 | -43.55 | 0.0070 | 0.0070 | |||
| RMX / Rubicon Minerals Corp. | 0.01 | 0.00 | 0.02 | 0.00 | 0.0009 | 0.0009 | |||
| DML / Denison Mines Corp. | 0.01 | -33.33 | 0.01 | -35.29 | 0.0005 | 0.0005 | |||
| SWSH / Swisher Hygiene, Inc. | 0.01 | 0.00 | 0.01 | -33.33 | 0.0003 | 0.0003 | |||
| FCX / Freeport-McMoRan Inc. | 0.00 | -100.00 | 0.00 | -100.00 | 0.0000 | 0.0000 | |||
| CROSSHAIR ENERGY CORP / (22765F105) | 0.00 | -100.00 | 0.00 | 0.0000 |