Basic Stats
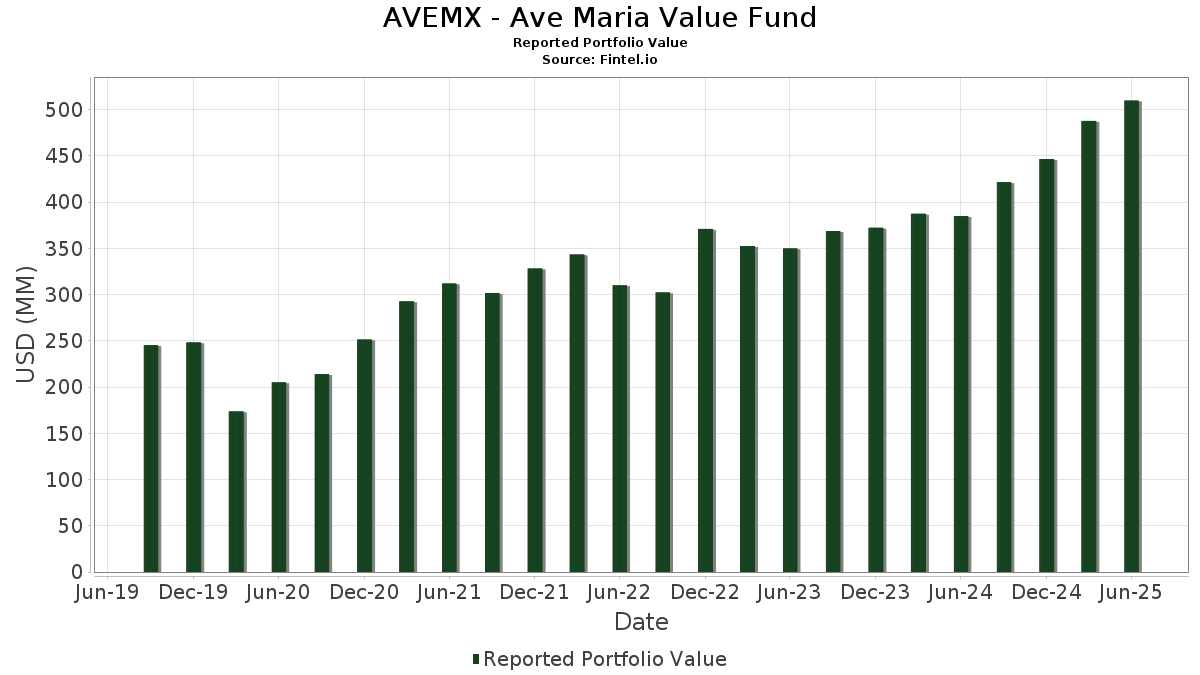
| Portfolio Value | $ 509,791,337 |
| Current Positions | 32 |
Latest Holdings, Performance, AUM (from 13F, 13D)
AVEMX - Ave Maria Value Fund has disclosed 32 total holdings in their latest SEC filings. Most recent portfolio value is calculated to be $ 509,791,337 USD. Actual Assets Under Management (AUM) is this value plus cash (which is not disclosed). AVEMX - Ave Maria Value Fund’s top holdings are Texas Pacific Land Corporation (US:TPL) , Haemonetics Corporation (US:HAE) , LandBridge Company LLC (US:LB) , TD SYNNEX Corporation (US:SNX) , and Wheaton Precious Metals Corp. (US:WPM) . AVEMX - Ave Maria Value Fund’s new positions include Federated Government Obligations Tax-Managed Fund Institutional Shares (US:US60934N8561) , Builders FirstSource, Inc. (US:BLDR) , .
Top Increases This Quarter
We use the change in the portfolio allocation because this is the most meaningful metric. Changes can be due to trades or changes in share prices.
| Security | Shares (MM) |
Value (MM$) |
Portfolio % | ΔPortfolio % |
|---|---|---|---|---|
| 0.02 | 10.20 | 2.0039 | 2.0039 | |
| 0.07 | 7.58 | 1.4897 | 1.4897 | |
| 0.17 | 23.00 | 4.5175 | 1.4764 | |
| 0.82 | 17.76 | 3.4885 | 1.0329 | |
| 0.34 | 25.07 | 4.9236 | 0.7621 | |
| 0.10 | 17.19 | 3.3760 | 0.6043 | |
| 0.26 | 9.24 | 1.8153 | 0.5882 | |
| 1.25 | 15.53 | 3.0503 | 0.5146 | |
| 0.23 | 20.20 | 3.9683 | 0.3827 | |
| 0.14 | 12.80 | 2.5141 | 0.3705 |
Top Decreases This Quarter
We use the change in the portfolio allocation because this is the most meaningful metric. Changes can be due to trades or changes in share prices.
| Security | Shares (MM) |
Value (MM$) |
Portfolio % | ΔPortfolio % |
|---|---|---|---|---|
| 0.07 | 70.25 | 13.7973 | -4.2904 | |
| 16.84 | 3.3068 | -1.0942 | ||
| 0.17 | 18.53 | 3.6397 | -0.6288 | |
| 0.36 | 24.12 | 4.7370 | -0.5336 | |
| 0.35 | 11.83 | 2.3234 | -0.3366 | |
| 0.32 | 9.93 | 1.9500 | -0.1903 | |
| 0.03 | 4.50 | 0.8846 | -0.0525 | |
| 0.10 | 16.39 | 3.2194 | -0.0150 | |
| 0.08 | 20.14 | 3.9551 | -0.0032 |
13F and Fund Filings
This form was filed on 2025-08-26 for the reporting period 2025-06-30. Click the link icon to see the full transaction history.
Upgrade to unlock premium data and export to Excel ![]() .
.
| Security | Type | Avg Share Price | Shares (MM) |
ΔShares (%) |
ΔShares (%) |
Value ($MM) |
Portfolio (%) |
ΔPortfolio (%) |
|
|---|---|---|---|---|---|---|---|---|---|
| TPL / Texas Pacific Land Corporation | 0.07 | 0.00 | 70.25 | -20.27 | 13.7973 | -4.2904 | |||
| HAE / Haemonetics Corporation | 0.34 | 5.33 | 25.07 | 23.66 | 4.9236 | 0.7621 | |||
| LB / LandBridge Company LLC | 0.36 | 0.00 | 24.12 | -6.06 | 4.7370 | -0.5336 | |||
| SNX / TD SYNNEX Corporation | 0.17 | 18.95 | 23.00 | 55.27 | 4.5175 | 1.4764 | |||
| WPM / Wheaton Precious Metals Corp. | 0.23 | 0.00 | 20.20 | 15.68 | 3.9683 | 0.3827 | |||
| HIFS / Hingham Institution for Savings | 0.08 | 0.00 | 20.14 | 4.43 | 3.9551 | -0.0032 | |||
| BRO / Brown & Brown, Inc. | 0.17 | 0.00 | 18.53 | -10.88 | 3.6397 | -0.6288 | |||
| MIR / Mirion Technologies, Inc. | 0.82 | 0.00 | 17.76 | 48.49 | 3.4885 | 1.0329 | |||
| CDW / CDW Corporation | 0.10 | 14.24 | 17.19 | 27.32 | 3.3760 | 0.6043 | |||
| EXE / Expand Energy Corporation | 0.15 | 0.00 | 17.01 | 5.04 | 3.3417 | 0.0168 | |||
| US60934N8561 / Federated Government Obligations Tax-Managed Fund Institutional Shares | 16.84 | -21.47 | 3.3068 | -1.0942 | |||||
| FNV / Franco-Nevada Corporation | 0.10 | 0.00 | 16.39 | 4.04 | 3.2194 | -0.0150 | |||
| PBT / Permian Basin Royalty Trust | 1.25 | 0.00 | 15.53 | 25.74 | 3.0503 | 0.5146 | |||
| OXY / Occidental Petroleum Corporation | 0.35 | 25.00 | 14.70 | 6.39 | 2.8878 | 0.0507 | |||
| ICE / Intercontinental Exchange, Inc. | 0.08 | 0.00 | 14.13 | 6.36 | 2.7746 | 0.0480 | |||
| CHE / Chemed Corporation | 0.03 | 50.71 | 13.43 | 19.26 | 2.6376 | 0.3261 | |||
| ALC / Alcon Inc. | 0.14 | 31.82 | 12.80 | 22.58 | 2.5141 | 0.3705 | |||
| JOE / The St. Joe Company | 0.27 | 3.88 | 12.77 | 5.54 | 2.5089 | 0.0242 | |||
| AWI / Armstrong World Industries, Inc. | 0.08 | 0.00 | 12.67 | 15.31 | 2.4885 | 0.2327 | |||
| AOS / A. O. Smith Corporation | 0.18 | 11.27 | 12.04 | 11.63 | 2.3644 | 0.1506 | |||
| SLB / Schlumberger Limited | 0.35 | 12.90 | 11.83 | -8.71 | 2.3234 | -0.3366 | |||
| VRSN / VeriSign, Inc. | 0.04 | 0.00 | 11.70 | 13.76 | 2.2972 | 0.1866 | |||
| ALLE / Allegion plc | 0.08 | 0.00 | 10.95 | 10.48 | 2.1512 | 0.1159 | |||
| HEIA / Heico Corp. - Class A | 0.04 | 0.00 | 10.35 | 22.66 | 2.0328 | 0.3004 | |||
| ROP / Roper Technologies, Inc. | 0.02 | 10.20 | 2.0039 | 2.0039 | |||||
| WINA / Winmark Corporation | 0.03 | 0.00 | 10.04 | 18.79 | 1.9727 | 0.2370 | |||
| YETI / YETI Holdings, Inc. | 0.32 | 0.00 | 9.93 | -4.78 | 1.9500 | -0.1903 | |||
| SMPL / The Simply Good Foods Company | 0.31 | 20.86 | 9.79 | 10.69 | 1.9233 | 0.1073 | |||
| XPEL / XPEL, Inc. | 0.26 | 26.54 | 9.24 | 54.63 | 1.8153 | 0.5882 | |||
| DSGR / Distribution Solutions Group, Inc. | 0.33 | 32.23 | 9.08 | 29.73 | 1.7827 | 0.3464 | |||
| BLDR / Builders FirstSource, Inc. | 0.07 | 7.58 | 1.4897 | 1.4897 | |||||
| JKHY / Jack Henry & Associates, Inc. | 0.03 | 0.00 | 4.50 | -1.34 | 0.8846 | -0.0525 |