Basic Stats
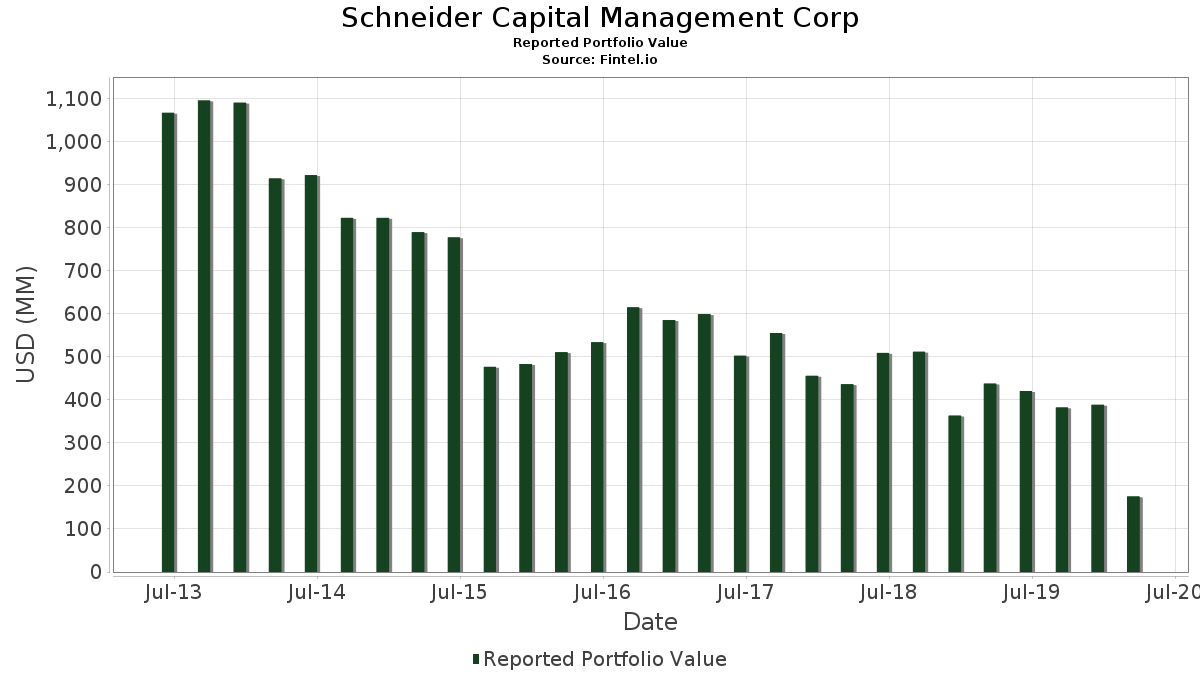
| Portfolio Value | $ 175,448,000 |
| Current Positions | 34 |
Latest Holdings, Performance, AUM (from 13F, 13D)
Schneider Capital Management Corp has disclosed 34 total holdings in their latest SEC filings. Most recent portfolio value is calculated to be $ 175,448,000 USD. Actual Assets Under Management (AUM) is this value plus cash (which is not disclosed). Schneider Capital Management Corp’s top holdings are Brighthouse Financial, Inc. (US:BHF) , Herc Holdings Inc. (US:HRI) , Univar Solutions Inc (US:UNVR) , Adient plc (US:ADNT) , and Olin Corporation (US:OLN) . Schneider Capital Management Corp’s new positions include United Rentals, Inc. (US:URI) , Halcon Resources Corporation NEW (US:HALC) , U.S. Xpress Enterprises Inc - Class A (US:USX) , .
Top Increases This Quarter
We use the change in the portfolio allocation because this is the most meaningful metric. Changes can be due to trades or changes in share prices.
| Security | Shares (MM) |
Value (MM$) |
Portfolio % | ΔPortfolio % |
|---|---|---|---|---|
| 0.98 | 11.45 | 6.5262 | 4.3446 | |
| 1.03 | 6.72 | 3.8279 | 3.8279 | |
| 0.65 | 11.35 | 6.4697 | 3.5359 | |
| 1.27 | 13.64 | 7.7755 | 3.1052 | |
| 0.03 | 3.51 | 2.0000 | 2.0000 | |
| 2.85 | 3.34 | 1.9031 | 1.9031 | |
| 0.34 | 4.01 | 2.2873 | 1.6340 | |
| 0.37 | 1.21 | 0.6885 | 0.6885 | |
| 0.53 | 7.01 | 3.9961 | 0.6328 | |
| 0.26 | 1.98 | 1.1308 | 0.5136 |
Top Decreases This Quarter
We use the change in the portfolio allocation because this is the most meaningful metric. Changes can be due to trades or changes in share prices.
| Security | Shares (MM) |
Value (MM$) |
Portfolio % | ΔPortfolio % |
|---|---|---|---|---|
| 2.98 | 3.46 | 1.9721 | -6.3118 | |
| 0.00 | 0.00 | -4.5836 | ||
| 0.52 | 9.88 | 5.6313 | -2.4393 | |
| 0.25 | 10.39 | 5.9197 | -1.6911 | |
| 1.28 | 11.62 | 6.6259 | -1.2852 | |
| 0.22 | 4.70 | 2.6760 | -0.9824 | |
| 0.00 | 0.00 | -0.7333 | ||
| 0.61 | 7.54 | 4.2987 | -0.6078 | |
| 0.67 | 13.76 | 7.8411 | -0.4742 | |
| 0.40 | 4.44 | 2.5307 | -0.2120 |
13F and Fund Filings
This form was filed on 2020-05-12 for the reporting period 2020-03-31. Click the link icon to see the full transaction history.
Upgrade to unlock premium data and export to Excel ![]() .
.
| Security | Type | Avg Share Price | Shares (MM) |
ΔShares (%) |
ΔShares (%) |
Value ($MM) |
Portfolio (%) |
ΔPortfolio (%) |
|
|---|---|---|---|---|---|---|---|---|---|
| BHF / Brighthouse Financial, Inc. | 0.59 | -23.65 | 14.30 | -52.96 | 8.1523 | 0.3297 | |||
| HRI / Herc Holdings Inc. | 0.67 | 1.81 | 13.76 | -57.43 | 7.8411 | -0.4742 | |||
| UNVR / Univar Solutions Inc | 1.27 | 69.94 | 13.64 | -24.85 | 7.7755 | 3.1052 | |||
| ADNT / Adient plc | 1.28 | -11.42 | 11.62 | -62.19 | 6.6259 | -1.2852 | |||
| OLN / Olin Corporation | 0.98 | 99.61 | 11.45 | 35.04 | 6.5262 | 4.3446 | |||
| SNV / Synovus Financial Corp. | 0.65 | 122.22 | 11.35 | -0.46 | 6.4697 | 3.5359 | |||
| C / Citigroup Inc. | 0.25 | -33.40 | 10.39 | -64.89 | 5.9197 | -1.6911 | |||
| STNG / Scorpio Tankers Inc. | 0.52 | -35.19 | 9.88 | -68.50 | 5.6313 | -2.4393 | |||
| KOP / Koppers Holdings Inc. | 0.61 | 22.19 | 7.54 | -60.45 | 4.2987 | -0.6078 | |||
| NWL / Newell Brands Inc. | 0.53 | -22.38 | 7.01 | -46.37 | 3.9961 | 0.6328 | |||
| CADE / Cadence Bank | 1.03 | 459.87 | 6.72 | 102.29 | 3.8279 | 3.8279 | |||
| VNTR / Venator Materials PLC | 3.89 | 3.41 | 6.68 | -53.56 | 3.8097 | 0.1065 | |||
| AGO / Assured Guaranty Ltd. | 0.24 | -12.14 | 6.17 | -53.78 | 3.5196 | 0.0824 | |||
| SM / SM Energy Company | 4.55 | 376.10 | 5.55 | -48.32 | 3.1622 | 0.3999 | |||
| KLIC / Kulicke and Soffa Industries, Inc. | 0.22 | -56.97 | 4.70 | -66.98 | 2.6760 | -0.9824 | |||
| MTW / The Manitowoc Company, Inc. | 0.55 | 1.41 | 4.67 | -50.75 | 2.6640 | 0.2224 | |||
| ALEX / Alexander & Baldwin, Inc. | 0.40 | -22.18 | 4.44 | -58.35 | 2.5307 | -0.2120 | |||
| DSSI / Diamond S Shipping Inc | 0.34 | 124.09 | 4.01 | 58.05 | 2.2873 | 1.6340 | |||
| URI / United Rentals, Inc. | 0.03 | 3.51 | 2.0000 | 2.0000 | |||||
| RIG / Transocean Ltd. | 2.98 | -36.26 | 3.46 | -89.25 | 1.9721 | -6.3118 | |||
| NEX / NexTier Oilfield Solutions Inc | 2.85 | 29.85 | 3.34 | -77.32 | 1.9031 | 1.9031 | |||
| CCJ / Cameco Corporation | 0.26 | -3.66 | 1.98 | -17.30 | 1.1308 | 0.5136 | |||
| AVNW / Aviat Networks, Inc. | 0.22 | -7.63 | 1.86 | -44.14 | 1.0590 | 0.2033 | |||
| US00C4U1L353 / Mylan N.V. | 0.12 | -0.69 | 1.72 | -26.33 | 0.9792 | 0.3792 | |||
| REVG / REV Group, Inc. | 0.41 | 33.93 | 1.70 | -54.35 | 0.9661 | 0.0108 | |||
| MOD / Modine Manufacturing Company | 0.37 | 1.21 | 0.6885 | 0.6885 | |||||
| IVAC / Intevac, Inc. | 0.28 | -28.84 | 1.14 | -58.75 | 0.6515 | -0.0615 | |||
| OFG / OFG Bancorp | 0.05 | -1.93 | 0.57 | -53.56 | 0.3232 | 0.0090 | |||
| HALC / Halcon Resources Corporation NEW | 0.06 | 0.30 | 0.1710 | 0.1710 | |||||
| HSON / Hudson Global, Inc. | 0.03 | 0.00 | 0.26 | -28.29 | 0.1459 | 0.0541 | |||
| IPI / Intrepid Potash, Inc. | 0.30 | 0.00 | 0.24 | -70.47 | 0.1374 | -0.0726 | |||
| KINS / Kingstone Companies, Inc. | 0.04 | -28.78 | 0.21 | -53.14 | 0.1191 | 0.0044 | |||
| USX / U.S. Xpress Enterprises Inc - Class A | 0.01 | 0.04 | 0.0239 | 0.0239 | |||||
| UTSI / UTStarcom Holdings Corp. | 0.02 | 0.00 | 0.03 | -41.30 | 0.0154 | 0.0036 | |||
| TUEM / Tuesday Morning Corp. - New | 0.00 | -100.00 | 0.00 | -100.00 | -0.0190 | ||||
| FHN / First Horizon Corporation | 0.00 | -100.00 | 0.00 | -100.00 | -0.7333 | ||||
| WLL / Whiting Petroleum Corp (New) | 0.00 | -100.00 | 0.00 | -100.00 | -4.5836 | ||||
| STCN / Steel Connect, Inc. | 0.00 | -100.00 | 0.00 | -100.00 | -0.0136 | ||||
| MOFG / MidWestOne Financial Group, Inc. | 0.00 | -100.00 | 0.00 | -100.00 | -0.0522 | ||||
| / McDermott International, Inc. | 0.00 | -100.00 | 0.00 | -100.00 | -0.0036 |