Basic Stats
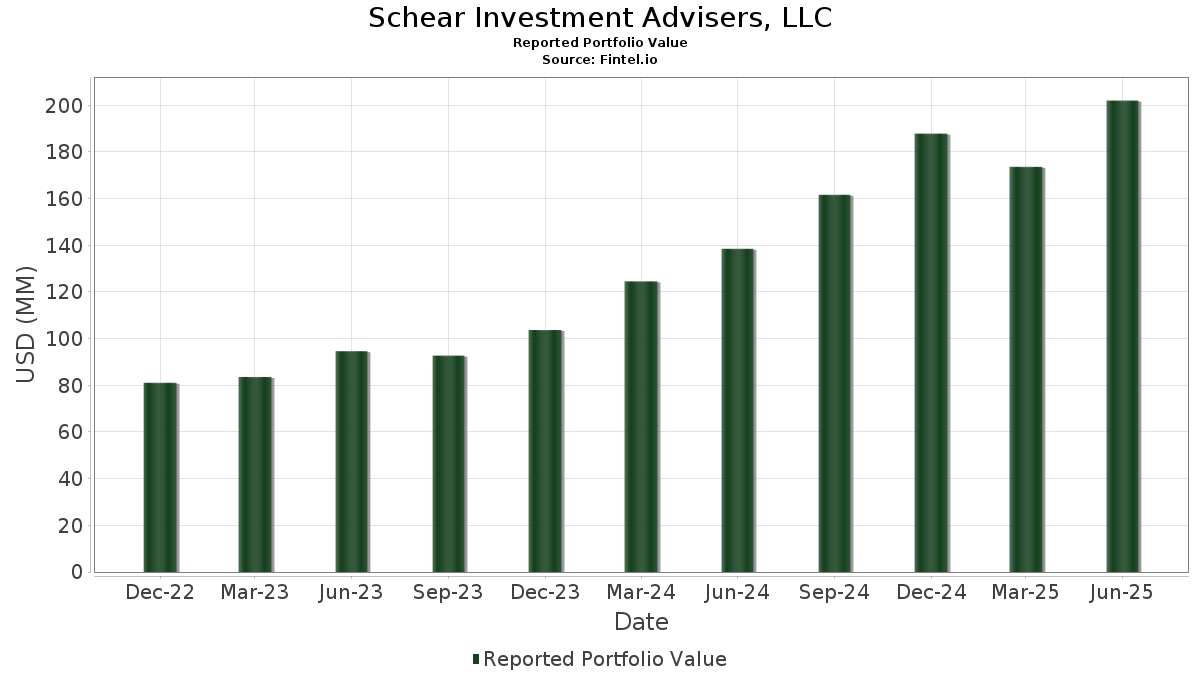
| Portfolio Value | $ 202,006,055 |
| Current Positions | 86 |
Latest Holdings, Performance, AUM (from 13F, 13D)
Schear Investment Advisers, LLC has disclosed 86 total holdings in their latest SEC filings. Most recent portfolio value is calculated to be $ 202,006,055 USD. Actual Assets Under Management (AUM) is this value plus cash (which is not disclosed). Schear Investment Advisers, LLC’s top holdings are NVIDIA Corporation (US:NVDA) , Broadcom Inc. (US:AVGO) , SPDR S&P 500 ETF (US:SPY) , Microsoft Corporation (US:MSFT) , and Alphabet Inc. (US:GOOGL) . Schear Investment Advisers, LLC’s new positions include VanEck ETF Trust - VanEck Semiconductor ETF (US:SMH) , Modine Manufacturing Company (US:MOD) , Vertiv Holdings Co (US:VRT) , Super Micro Computer, Inc. (US:SMCI) , and .
Top Increases This Quarter
We use the change in the portfolio allocation because this is the most meaningful metric. Changes can be due to trades or changes in share prices.
| Security | Shares (MM) |
Value (MM$) |
Portfolio % | ΔPortfolio % |
|---|---|---|---|---|
| 0.02 | 9.52 | 4.7136 | 4.4983 | |
| 0.04 | 12.17 | 6.0259 | 1.6778 | |
| 0.01 | 6.21 | 3.0753 | 1.0285 | |
| 0.01 | 1.96 | 0.9701 | 0.9701 | |
| 0.02 | 1.55 | 0.7658 | 0.7658 | |
| 0.02 | 3.00 | 1.4864 | 0.4676 | |
| 0.01 | 3.14 | 1.5538 | 0.4477 | |
| 0.01 | 3.76 | 1.8607 | 0.3987 | |
| 0.01 | 7.43 | 3.6775 | 0.3935 | |
| 0.01 | 1.58 | 0.7813 | 0.3707 |
Top Decreases This Quarter
We use the change in the portfolio allocation because this is the most meaningful metric. Changes can be due to trades or changes in share prices.
| Security | Shares (MM) |
Value (MM$) |
Portfolio % | ΔPortfolio % |
|---|---|---|---|---|
| 0.01 | 5.72 | 2.8297 | -2.8176 | |
| 0.00 | 1.13 | 0.5574 | -2.2708 | |
| 0.03 | 5.98 | 2.9627 | -1.0547 | |
| 0.01 | 5.51 | 2.7267 | -0.7541 | |
| 0.00 | 1.46 | 0.7209 | -0.6985 | |
| 0.00 | 4.69 | 2.3229 | -0.2888 | |
| 0.00 | 0.20 | 0.1000 | -0.2792 | |
| 0.01 | 3.34 | 1.6546 | -0.2774 | |
| 0.01 | 0.98 | 0.4834 | -0.2315 | |
| 0.01 | 1.59 | 0.7858 | -0.2274 |
13F and Fund Filings
This form was filed on 2025-08-14 for the reporting period 2025-06-30. Click the link icon to see the full transaction history.
Upgrade to unlock premium data and export to Excel ![]() .
.
| Security | Type | Avg Share Price | Shares (MM) |
ΔShares (%) |
ΔShares (%) |
Value ($MM) |
Portfolio (%) |
ΔPortfolio (%) |
|
|---|---|---|---|---|---|---|---|---|---|
| NVDA / NVIDIA Corporation | 0.10 | -19.16 | 15.40 | 17.85 | 7.6251 | 0.0967 | |||
| AVGO / Broadcom Inc. | 0.04 | -2.05 | 12.17 | 61.26 | 6.0259 | 1.6778 | |||
| SPY / SPDR S&P 500 ETF | 0.02 | 2,207.04 | 9.52 | 2,452.55 | 4.7136 | 4.4983 | |||
| MSFT / Microsoft Corporation | 0.01 | -1.67 | 7.43 | 30.29 | 3.6775 | 0.3935 | |||
| GOOGL / Alphabet Inc. | 0.04 | -0.86 | 6.51 | 12.97 | 3.2217 | -0.0962 | |||
| META / Meta Platforms, Inc. | 0.01 | 0.60 | 6.43 | 28.82 | 3.1825 | 0.3082 | |||
| GEV / GE Vernova Inc. | 0.01 | 0.86 | 6.21 | 74.84 | 3.0753 | 1.0285 | |||
| AAPL / Apple Inc. | 0.03 | -7.10 | 5.98 | -14.20 | 2.9627 | -1.0547 | |||
| AMZN / Amazon.com, Inc. | 0.03 | -0.09 | 5.83 | 15.21 | 2.8868 | -0.0288 | |||
| VOO / Vanguard Index Funds - Vanguard S&P 500 ETF | 0.01 | -47.25 | 5.72 | -41.70 | 2.8297 | -2.8176 | |||
| LLY / Eli Lilly and Company | 0.01 | -3.43 | 5.51 | -8.85 | 2.7267 | -0.7541 | |||
| COST / Costco Wholesale Corporation | 0.00 | -1.13 | 4.69 | 3.48 | 2.3229 | -0.2888 | |||
| JPM / JPMorgan Chase & Co. | 0.01 | -0.13 | 3.88 | 18.03 | 1.9185 | 0.0273 | |||
| CRWD / CrowdStrike Holdings, Inc. | 0.01 | 2.51 | 3.76 | 48.07 | 1.8607 | 0.3987 | |||
| V / Visa Inc. | 0.01 | -1.64 | 3.34 | -0.36 | 1.6546 | -0.2774 | |||
| AMD / Advanced Micro Devices, Inc. | 0.02 | -4.90 | 3.31 | 31.34 | 1.6392 | 0.1871 | |||
| C / Citigroup Inc. | 0.04 | 2.67 | 3.19 | 23.12 | 1.5767 | 0.0864 | |||
| ORCL / Oracle Corporation | 0.01 | 4.52 | 3.14 | 63.44 | 1.5538 | 0.4477 | |||
| MU / Micron Technology, Inc. | 0.02 | 19.68 | 3.00 | 69.80 | 1.4864 | 0.4676 | |||
| BSX / Boston Scientific Corporation | 0.03 | 5.33 | 2.74 | 12.14 | 1.3582 | -0.0509 | |||
| CAT / Caterpillar Inc. | 0.01 | -1.10 | 2.68 | 16.42 | 1.3268 | 0.0007 | |||
| HD / The Home Depot, Inc. | 0.01 | -1.70 | 2.47 | -1.67 | 1.2249 | -0.2245 | |||
| MS / Morgan Stanley | 0.02 | 5.84 | 2.46 | 27.81 | 1.2175 | 0.1089 | |||
| GS / The Goldman Sachs Group, Inc. | 0.00 | -0.89 | 2.45 | 28.41 | 1.2108 | 0.1136 | |||
| TSM / Taiwan Semiconductor Manufacturing Company Limited - Depositary Receipt (Common Stock) | 0.01 | 22.14 | 2.29 | 66.64 | 1.1354 | 0.3427 | |||
| PNC / The PNC Financial Services Group, Inc. | 0.01 | 3.25 | 2.27 | 9.55 | 1.1249 | -0.0703 | |||
| MRVL / Marvell Technology, Inc. | 0.03 | -9.30 | 2.25 | 14.00 | 1.1128 | -0.0228 | |||
| GE / General Electric Company | 0.01 | 4.88 | 2.13 | 34.84 | 1.0523 | 0.1445 | |||
| AJG / Arthur J. Gallagher & Co. | 0.01 | 10.41 | 2.08 | 2.37 | 1.0285 | -0.1404 | |||
| LIN / Linde plc | 0.00 | 1.48 | 2.06 | 2.23 | 1.0215 | -0.1409 | |||
| ULTA / Ulta Beauty, Inc. | 0.00 | -2.38 | 2.05 | 24.62 | 1.0150 | 0.0671 | |||
| SMH / VanEck ETF Trust - VanEck Semiconductor ETF | 0.01 | 1.96 | 0.9701 | 0.9701 | |||||
| COR / Cencora, Inc. | 0.01 | 1.73 | 1.96 | 9.70 | 0.9690 | -0.0589 | |||
| ETN / Eaton Corporation plc | 0.01 | 13.48 | 1.94 | 49.04 | 0.9614 | 0.2108 | |||
| TJX / The TJX Companies, Inc. | 0.02 | 1.61 | 1.90 | 2.99 | 0.9394 | -0.1216 | |||
| MCK / McKesson Corporation | 0.00 | 3.04 | 1.89 | 12.20 | 0.9334 | -0.0346 | |||
| MSI / Motorola Solutions, Inc. | 0.00 | 1.28 | 1.87 | -2.71 | 0.9233 | -0.1812 | |||
| CB / Chubb Limited | 0.01 | -0.72 | 1.84 | -4.76 | 0.9110 | -0.2019 | |||
| DAL / Delta Air Lines, Inc. | 0.04 | 22.29 | 1.76 | 37.94 | 0.8695 | 0.1360 | |||
| CTRA / Coterra Energy Inc. | 0.07 | 13.64 | 1.65 | -0.18 | 0.8170 | -0.1355 | |||
| ADBE / Adobe Inc. | 0.00 | -2.73 | 1.60 | -1.84 | 0.7927 | -0.1473 | |||
| AMGN / Amgen Inc. | 0.01 | 0.69 | 1.59 | -9.78 | 0.7858 | -0.2274 | |||
| VST / Vistra Corp. | 0.01 | 34.17 | 1.58 | 121.63 | 0.7813 | 0.3707 | |||
| MOD / Modine Manufacturing Company | 0.02 | 1.55 | 0.7658 | 0.7658 | |||||
| UNP / Union Pacific Corporation | 0.01 | -3.04 | 1.50 | -5.56 | 0.7409 | -0.1720 | |||
| MLM / Martin Marietta Materials, Inc. | 0.00 | -0.55 | 1.49 | 14.18 | 0.7378 | -0.0140 | |||
| CEG / Constellation Energy Corporation | 0.00 | 40.21 | 1.48 | 124.62 | 0.7321 | 0.3526 | |||
| UNH / UnitedHealth Group Incorporated | 0.00 | -0.79 | 1.46 | -40.91 | 0.7209 | -0.6985 | |||
| INTU / Intuit Inc. | 0.00 | -4.07 | 1.45 | 23.02 | 0.7170 | 0.0391 | |||
| SYK / Stryker Corporation | 0.00 | -0.38 | 1.45 | 5.86 | 0.7162 | -0.0709 | |||
| WMT / Walmart Inc. | 0.01 | 2.83 | 1.45 | 14.58 | 0.7159 | -0.0114 | |||
| HON / Honeywell International Inc. | 0.01 | -2.20 | 1.36 | 7.57 | 0.6756 | -0.0553 | |||
| TMUS / T-Mobile US, Inc. | 0.01 | 3.46 | 1.35 | -7.54 | 0.6673 | -0.1728 | |||
| CVX / Chevron Corporation | 0.01 | 5.15 | 1.28 | -10.04 | 0.6351 | -0.1860 | |||
| URI / United Rentals, Inc. | 0.00 | -3.44 | 1.23 | 16.08 | 0.6076 | -0.0014 | |||
| ACN / Accenture plc | 0.00 | -1.62 | 1.17 | -5.74 | 0.5768 | -0.1354 | |||
| DE / Deere & Company | 0.00 | -1.35 | 1.16 | 6.85 | 0.5722 | -0.0507 | |||
| QQQ / Invesco QQQ Trust, Series 1 | 0.00 | -80.51 | 1.13 | -77.09 | 0.5574 | -2.2708 | |||
| GEHC / GE HealthCare Technologies Inc. | 0.01 | -0.96 | 1.10 | -9.06 | 0.5466 | -0.1532 | |||
| APD / Air Products and Chemicals, Inc. | 0.00 | 2.47 | 1.10 | -2.05 | 0.5450 | -0.1021 | |||
| AXP / American Express Company | 0.00 | 62.23 | 1.10 | 92.62 | 0.5426 | 0.2143 | |||
| BAC / Bank of America Corporation | 0.02 | -0.98 | 1.09 | 12.35 | 0.5407 | -0.0196 | |||
| PG / The Procter & Gamble Company | 0.01 | 28.75 | 1.02 | 20.40 | 0.5055 | 0.0168 | |||
| CLX / The Clorox Company | 0.01 | -3.51 | 0.98 | -21.35 | 0.4834 | -0.2315 | |||
| BLK / BlackRock, Inc. | 0.00 | -1.81 | 0.91 | 8.84 | 0.4514 | -0.0311 | |||
| RTX / RTX Corporation | 0.01 | -5.47 | 0.87 | 4.22 | 0.4286 | -0.0500 | |||
| LULU / lululemon athletica inc. | 0.00 | 2.51 | 0.79 | -13.98 | 0.3932 | -0.1385 | |||
| DHI / D.R. Horton, Inc. | 0.01 | -9.20 | 0.74 | -7.94 | 0.3677 | -0.0970 | |||
| MCD / McDonald's Corporation | 0.00 | 1.78 | 0.74 | -4.79 | 0.3642 | -0.0809 | |||
| MMC / Marsh & McLennan Companies, Inc. | 0.00 | 2.41 | 0.73 | -8.22 | 0.3594 | -0.0964 | |||
| LMT / Lockheed Martin Corporation | 0.00 | 29.84 | 0.69 | 34.83 | 0.3412 | 0.0463 | |||
| VRT / Vertiv Holdings Co | 0.01 | 0.65 | 0.3239 | 0.3239 | |||||
| JNJ / Johnson & Johnson | 0.00 | -2.90 | 0.60 | -10.48 | 0.2960 | -0.0891 | |||
| KO / The Coca-Cola Company | 0.01 | 3.66 | 0.45 | 2.52 | 0.2214 | -0.0302 | |||
| CINF / Cincinnati Financial Corporation | 0.00 | 16.59 | 0.43 | 17.53 | 0.2124 | 0.0021 | |||
| EPD / Enterprise Products Partners L.P. - Limited Partnership | 0.01 | 0.00 | 0.43 | -9.17 | 0.2111 | -0.0593 | |||
| TGT / Target Corporation | 0.00 | -0.08 | 0.39 | -5.53 | 0.1950 | -0.0452 | |||
| LHX / L3Harris Technologies, Inc. | 0.00 | 29.84 | 0.32 | 55.61 | 0.1583 | 0.0399 | |||
| ZTS / Zoetis Inc. | 0.00 | 0.00 | 0.31 | -5.52 | 0.1529 | -0.0349 | |||
| LOW / Lowe's Companies, Inc. | 0.00 | 0.00 | 0.28 | -5.15 | 0.1371 | -0.0306 | |||
| SMCI / Super Micro Computer, Inc. | 0.01 | 0.25 | 0.1241 | 0.1241 | |||||
| MPC / Marathon Petroleum Corporation | 0.00 | -23.85 | 0.24 | -13.26 | 0.1200 | -0.0408 | |||
| WMB / The Williams Companies, Inc. | 0.00 | 0.00 | 0.23 | 5.45 | 0.1150 | -0.0123 | |||
| ABBV / AbbVie Inc. | 0.00 | -13.50 | 0.21 | -23.25 | 0.1030 | -0.0534 | |||
| FANG / Diamondback Energy, Inc. | 0.00 | -64.29 | 0.20 | -69.45 | 0.1000 | -0.2792 | |||
| MA / Mastercard Incorporated | 0.00 | -6.54 | 0.20 | -4.31 | 0.0993 | -0.0213 | |||
| NVO / Novo Nordisk A/S - Depositary Receipt (Common Stock) | 0.00 | -100.00 | 0.00 | -100.00 | -0.1218 | ||||
| STZ / Constellation Brands, Inc. | 0.00 | -100.00 | 0.00 | 0.0000 | |||||
| TMO / Thermo Fisher Scientific Inc. | 0.00 | -100.00 | 0.00 | 0.0000 | |||||
| MDLZ / Mondelez International, Inc. | 0.00 | -100.00 | 0.00 | 0.0000 | |||||
| PEP / PepsiCo, Inc. | 0.00 | -100.00 | 0.00 | 0.0000 | |||||
| PSX / Phillips 66 | 0.00 | -100.00 | 0.00 | 0.0000 | |||||
| MRK / Merck & Co., Inc. | 0.00 | -100.00 | 0.00 | 0.0000 |