Basic Stats
| Insider Profile | SCGE MANAGEMENT, L.P. |
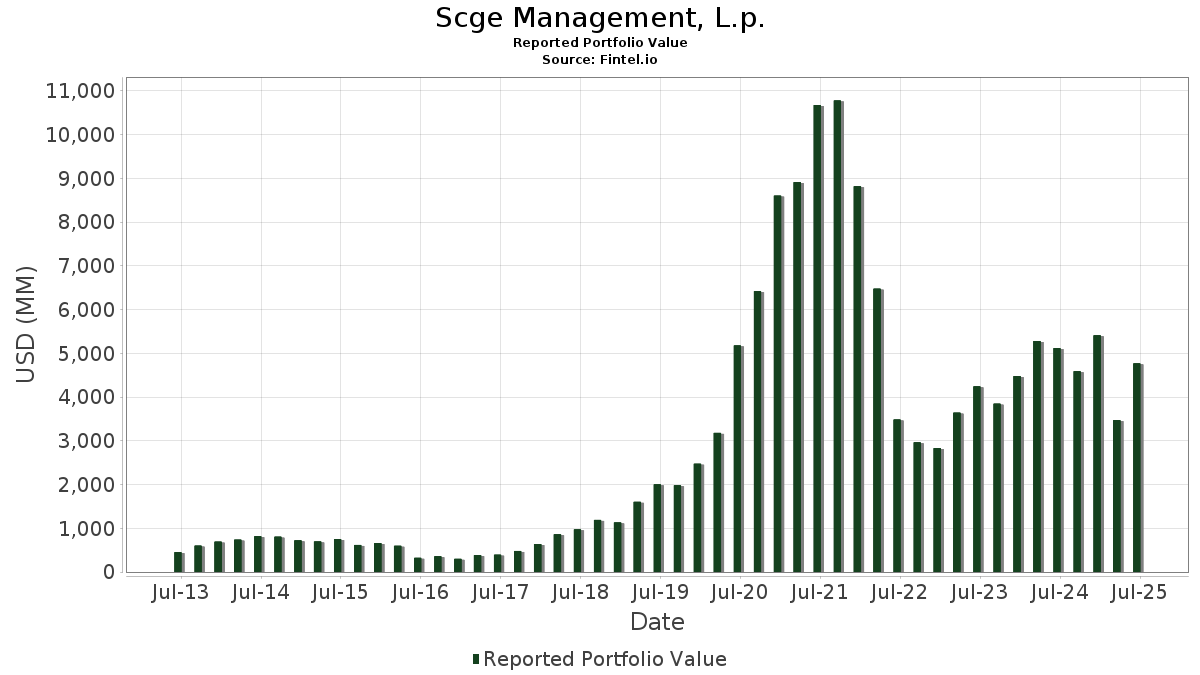
| Portfolio Value | $ 4,768,008,084 |
| Current Positions | 20 |
Latest Holdings, Performance, AUM (from 13F, 13D)
Scge Management, L.p. has disclosed 20 total holdings in their latest SEC filings. Most recent portfolio value is calculated to be $ 4,768,008,084 USD. Actual Assets Under Management (AUM) is this value plus cash (which is not disclosed). Scge Management, L.p.’s top holdings are Meta Platforms, Inc. (US:META) , Palo Alto Networks, Inc. (US:PANW) , Broadcom Inc. (US:AVGO) , NVIDIA Corporation (US:NVDA) , and Oracle Corporation (US:ORCL) . Scge Management, L.p.’s new positions include Oracle Corporation (US:ORCL) , Spotify Technology S.A. (US:SPOT) , Dynatrace, Inc. (US:DT) , Chime Financial, Inc. (US:CHYM) , and .
Top Increases This Quarter
We use the change in the portfolio allocation because this is the most meaningful metric. Changes can be due to trades or changes in share prices.
| Security | Shares (MM) |
Value (MM$) |
Portfolio % | ΔPortfolio % |
|---|---|---|---|---|
| 1.33 | 291.22 | 6.1077 | 6.1077 | |
| 1.08 | 267.46 | 5.6095 | 5.6095 | |
| 0.33 | 250.15 | 5.2465 | 5.2465 | |
| 0.46 | 228.31 | 4.7884 | 4.7884 | |
| 0.61 | 187.66 | 3.9359 | 3.9359 | |
| 2.82 | 155.86 | 3.2688 | 3.2688 | |
| 4.42 | 152.56 | 3.1997 | 3.1997 | |
| 0.63 | 140.53 | 2.9473 | 2.9473 | |
| 1.28 | 351.59 | 7.3740 | 1.5512 |
Top Decreases This Quarter
We use the change in the portfolio allocation because this is the most meaningful metric. Changes can be due to trades or changes in share prices.
| Security | Shares (MM) |
Value (MM$) |
Portfolio % | ΔPortfolio % |
|---|---|---|---|---|
| 0.24 | 250.85 | 5.2611 | -4.7174 | |
| 1.14 | 250.76 | 5.2593 | -4.0052 | |
| 1.75 | 280.69 | 5.8870 | -2.2341 | |
| 0.56 | 125.93 | 2.6411 | -1.1900 | |
| 1.89 | 385.75 | 8.0903 | -1.1776 | |
| 1.18 | 16.14 | 0.3385 | -1.1298 | |
| 0.97 | 714.47 | 14.9847 | -1.0906 | |
| 1.23 | 131.75 | 2.7633 | -0.6054 | |
| 2.16 | 340.94 | 7.1506 | -0.1441 | |
| 0.28 | 12.67 | 0.2657 | -0.0562 |
13F and Fund Filings
This form was filed on 2025-08-14 for the reporting period 2025-06-30. Click the link icon to see the full transaction history.
Upgrade to unlock premium data and export to Excel ![]() .
.
| Security | Type | Avg Share Price | Shares (MM) |
ΔShares (%) |
ΔShares (%) |
Value ($MM) |
Portfolio (%) |
ΔPortfolio (%) |
|
|---|---|---|---|---|---|---|---|---|---|
| META / Meta Platforms, Inc. | 0.97 | 0.00 | 714.47 | 28.06 | 14.9847 | -1.0906 | |||
| PANW / Palo Alto Networks, Inc. | 1.89 | 0.00 | 385.75 | 19.93 | 8.0903 | -1.1776 | |||
| AVGO / Broadcom Inc. | 1.28 | 5.68 | 351.59 | 73.98 | 7.3740 | 1.5512 | |||
| NVDA / NVIDIA Corporation | 2.16 | -7.62 | 340.94 | 34.67 | 7.1506 | -0.1441 | |||
| ORCL / Oracle Corporation | 1.33 | 291.22 | 6.1077 | 6.1077 | |||||
| SE / Sea Limited - Depositary Receipt (Common Stock) | 1.75 | -18.75 | 280.69 | -0.41 | 5.8870 | -2.2341 | |||
| DASH / DoorDash, Inc. | 1.08 | 267.46 | 5.6095 | 5.6095 | |||||
| NOW / ServiceNow, Inc. | 0.24 | -43.91 | 250.85 | -27.57 | 5.2611 | -4.7174 | |||
| AMZN / Amazon.com, Inc. | 1.14 | -32.37 | 250.76 | -22.01 | 5.2593 | -4.0052 | |||
| SPOT / Spotify Technology S.A. | 0.33 | 250.15 | 5.2465 | 5.2465 | |||||
| CPNG / Coupang, Inc. | 7.77 | 0.00 | 232.70 | 36.62 | 4.8804 | -0.0273 | |||
| MSFT / Microsoft Corporation | 0.46 | 228.31 | 4.7884 | 4.7884 | |||||
| CDNS / Cadence Design Systems, Inc. | 0.61 | 187.66 | 3.9359 | 3.9359 | |||||
| DT / Dynatrace, Inc. | 2.82 | 155.86 | 3.2688 | 3.2688 | |||||
| CHYM / Chime Financial, Inc. | 4.42 | 152.56 | 3.1997 | 3.1997 | |||||
| SNOW / Snowflake Inc. | 0.63 | 140.53 | 2.9473 | 2.9473 | |||||
| TTAN / ServiceTitan, Inc. | 1.23 | 0.00 | 131.75 | 12.69 | 2.7633 | -0.6054 | |||
| TSM / Taiwan Semiconductor Manufacturing Company Limited - Depositary Receipt (Common Stock) | 0.56 | -30.59 | 125.93 | -5.29 | 2.6411 | -1.1900 | |||
| NU / Nu Holdings Ltd. | 1.18 | -76.36 | 16.14 | -68.33 | 0.3385 | -1.1298 | |||
| CART / Maplebear Inc. | 0.28 | 0.00 | 12.67 | 13.41 | 0.2657 | -0.0562 | |||
| TEAM / Atlassian Corporation | 0.00 | -100.00 | 0.00 | 0.0000 | |||||
| RDDT / Reddit, Inc. | 0.00 | -100.00 | 0.00 | 0.0000 | |||||
| SHOP / Shopify Inc. | 0.00 | -100.00 | 0.00 | 0.0000 |