Basic Stats
| Portfolio Value | $ 18,459,746 |
| Current Positions | 14 |
Latest Holdings, Performance, AUM (from 13F, 13D)
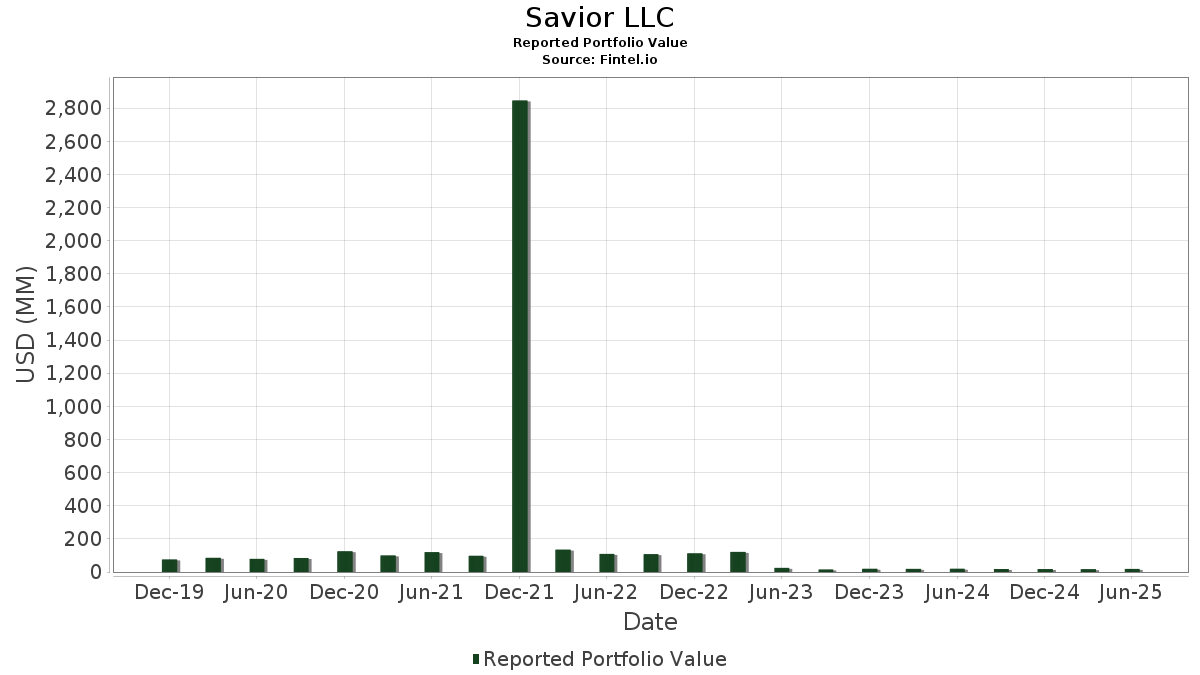
Savior LLC has disclosed 14 total holdings in their latest SEC filings. Most recent portfolio value is calculated to be $ 18,459,746 USD. Actual Assets Under Management (AUM) is this value plus cash (which is not disclosed). Savior LLC’s top holdings are SPDR Series Trust - SPDR Bloomberg 1-3 Month T-Bill ETF (US:BIL) , The Select Sector SPDR Trust - The Utilities Select Sector SPDR Fund (US:XLU) , Invesco DB Multi-Sector Commodity Trust - Invesco DB Agriculture Fund (US:DBA) , SPDR Gold Trust (US:GLD) , and iShares Trust - iShares 7-10 Year Treasury Bond ETF (US:IEF) .
Top Increases This Quarter
We use the change in the portfolio allocation because this is the most meaningful metric. Changes can be due to trades or changes in share prices.
| Security | Shares (MM) |
Value (MM$) |
Portfolio % | ΔPortfolio % |
|---|---|---|---|---|
| 0.05 | 4.99 | 27.0174 | 5.3290 | |
| 0.02 | 0.95 | 5.1278 | 2.1526 | |
| 0.00 | 0.29 | 1.5604 | 1.5604 | |
| 0.01 | 1.31 | 7.0772 | 1.3918 | |
| 0.01 | 1.19 | 6.4477 | 0.6076 | |
| 0.02 | 1.82 | 9.8600 | 0.4815 | |
| 0.00 | 0.89 | 4.8255 | 0.4579 | |
| 0.01 | 0.69 | 3.7387 | 0.4365 | |
| 0.00 | 1.46 | 7.8950 | 0.2880 | |
| 0.02 | 0.87 | 4.7074 | 0.1287 |
Top Decreases This Quarter
We use the change in the portfolio allocation because this is the most meaningful metric. Changes can be due to trades or changes in share prices.
| Security | Shares (MM) |
Value (MM$) |
Portfolio % | ΔPortfolio % |
|---|---|---|---|---|
| 0.01 | 0.39 | 2.1195 | -0.1755 | |
| 0.06 | 1.70 | 9.1860 | -0.1333 | |
| 0.03 | 1.30 | 7.0670 | -0.0116 |
13F and Fund Filings
This form was filed on 2025-07-14 for the reporting period 2025-06-30. Click the link icon to see the full transaction history.
Upgrade to unlock premium data and export to Excel ![]() .
.