Basic Stats
| Portfolio Value | $ 481,640,873 |
| Current Positions | 98 |
Latest Holdings, Performance, AUM (from 13F, 13D)
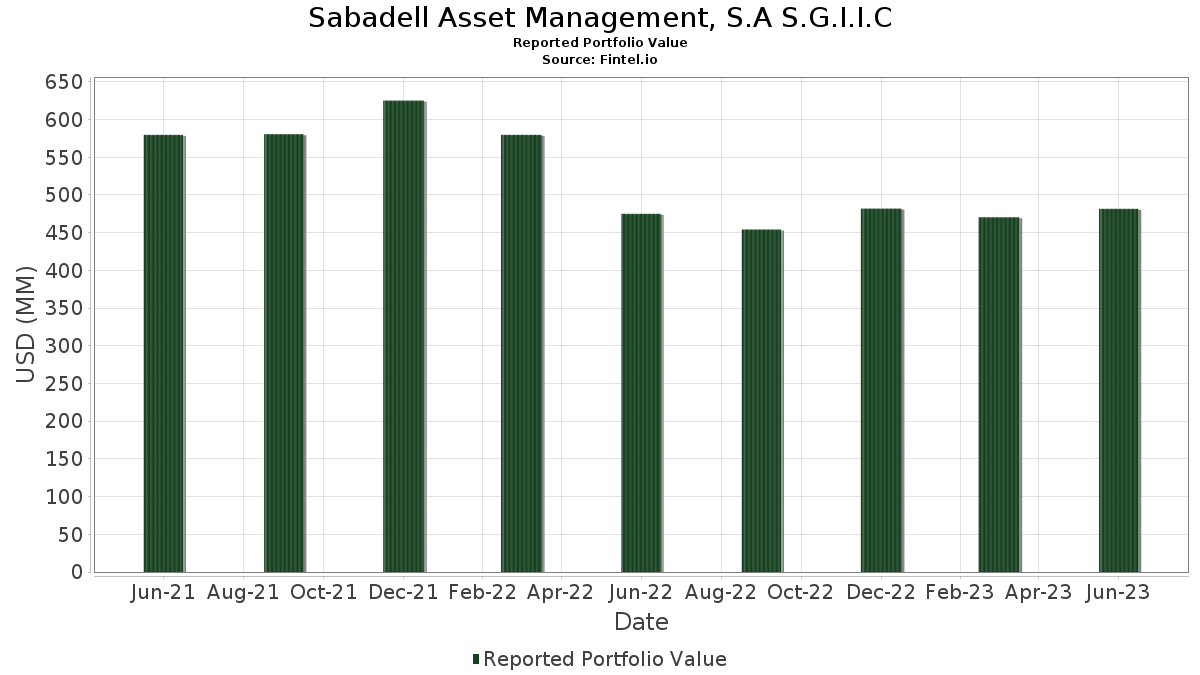
Sabadell Asset Management, S.A S.G.I.I.C has disclosed 98 total holdings in their latest SEC filings. Most recent portfolio value is calculated to be $ 481,640,873 USD. Actual Assets Under Management (AUM) is this value plus cash (which is not disclosed). Sabadell Asset Management, S.A S.G.I.I.C’s top holdings are Microsoft Corporation (US:MSFT) , Meta Platforms, Inc. (US:META) , Apple Inc. (US:AAPL) , Amazon.com, Inc. (US:AMZN) , and Alphabet Inc. (US:GOOGL) . Sabadell Asset Management, S.A S.G.I.I.C’s new positions include Alcon Inc. (US:ALC) , .
Top Increases This Quarter
We use the change in the portfolio allocation because this is the most meaningful metric. Changes can be due to trades or changes in share prices.
| Security | Shares (MM) |
Value (MM$) |
Portfolio % | ΔPortfolio % |
|---|---|---|---|---|
| 0.12 | 14.35 | 2.9785 | 1.8862 | |
| 0.07 | 9.92 | 1.9747 | 1.7530 | |
| 0.10 | 8.85 | 1.8366 | 0.9030 | |
| 0.18 | 9.76 | 2.0262 | 0.8438 | |
| 0.11 | 14.41 | 2.9923 | 0.5931 | |
| 0.03 | 12.56 | 2.6076 | 0.5371 | |
| 0.13 | 7.42 | 1.5414 | 0.5272 | |
| 0.11 | 20.93 | 4.3456 | 0.4996 | |
| 0.20 | 12.28 | 2.5487 | 0.4557 | |
| 0.22 | 10.07 | 2.0905 | 0.4374 |
Top Decreases This Quarter
We use the change in the portfolio allocation because this is the most meaningful metric. Changes can be due to trades or changes in share prices.
| Security | Shares (MM) |
Value (MM$) |
Portfolio % | ΔPortfolio % |
|---|---|---|---|---|
| 0.02 | 1.26 | 0.2622 | -1.4152 | |
| 0.01 | 1.04 | 0.2164 | -1.0712 | |
| 0.04 | 3.97 | 0.8250 | -0.9740 | |
| 0.00 | 0.00 | -0.7574 | ||
| 0.00 | 0.00 | -0.7420 | ||
| 0.17 | 7.29 | 1.5141 | -0.7392 | |
| 0.08 | 22.81 | 4.7353 | -0.7363 | |
| 0.00 | 0.00 | -0.7194 | ||
| 0.04 | 7.22 | 1.4986 | -0.4607 | |
| 0.04 | 10.32 | 2.1417 | -0.3493 |
13F and Fund Filings
This form was filed on 2024-01-23 for the reporting period 2023-06-30. Click the link icon to see the full transaction history.
Upgrade to unlock premium data and export to Excel ![]() .
.
| Security | Type | Avg Share Price | Shares (MM) |
ΔShares (%) |
ΔShares (%) |
Value ($MM) |
Portfolio (%) |
ΔPortfolio (%) |
|
|---|---|---|---|---|---|---|---|---|---|
| MSFT / Microsoft Corporation | 0.09 | -14.82 | 29.47 | 1.25 | 6.1182 | -0.0683 | |||
| META / Meta Platforms, Inc. | 0.08 | -34.48 | 22.81 | -11.39 | 4.7353 | -0.7363 | |||
| AAPL / Apple Inc. | 0.11 | -1.57 | 20.93 | 15.69 | 4.3456 | 0.4996 | |||
| AMZN / Amazon.com, Inc. | 0.11 | -0.86 | 14.41 | 27.69 | 2.9923 | 0.5931 | |||
| GOOGL / Alphabet Inc. | 0.12 | 143.05 | 14.35 | 179.19 | 2.9785 | 1.8862 | |||
| GOOGL / Alphabet Inc. | 0.12 | -0.77 | 14.24 | 13.89 | 2.9562 | 0.2986 | |||
| NFLX / Netflix, Inc. | 0.03 | 0.00 | 12.56 | 28.94 | 2.6076 | 0.5371 | |||
| KO / The Coca-Cola Company | 0.20 | 29.24 | 12.28 | 24.68 | 2.5487 | 0.4557 | |||
| MRK / Merck & Co., Inc. | 0.10 | -4.97 | 11.70 | -2.91 | 2.4301 | -0.1327 | |||
| AMD / Advanced Micro Devices, Inc. | 0.10 | -4.34 | 11.63 | 19.69 | 2.4143 | 0.3491 | |||
| HD / The Home Depot, Inc. | 0.04 | -5.69 | 11.26 | 1.28 | 2.3387 | -0.0254 | |||
| AMT / American Tower Corporation | 0.06 | -4.98 | 10.99 | -9.46 | 2.2828 | -0.2986 | |||
| AEM / Agnico Eagle Mines Limited | 0.21 | 34.67 | 10.37 | 21.66 | 2.0641 | 0.3257 | |||
| V / Visa Inc. | 0.04 | -15.60 | 10.32 | -11.97 | 2.1417 | -0.3493 | |||
| PFE / Pfizer Inc. | 0.28 | 12.48 | 10.14 | -0.79 | 2.1061 | -0.0673 | |||
| BK / The Bank of New York Mellon Corporation | 0.22 | 28.93 | 10.07 | 29.48 | 2.0905 | 0.4374 | |||
| PG / The Procter & Gamble Company | 0.07 | 805.47 | 9.92 | 813.26 | 1.9747 | 1.7530 | |||
| BSX / Boston Scientific Corporation | 0.18 | 66.28 | 9.76 | 75.44 | 2.0262 | 0.8438 | |||
| ADBE / Adobe Inc. | 0.02 | -30.63 | 9.32 | -11.89 | 1.9348 | -0.3136 | |||
| T / AT&T Inc. | 0.57 | 28.00 | 9.14 | 3.79 | 1.8986 | 0.0257 | |||
| ICE / Intercontinental Exchange, Inc. | 0.08 | -4.97 | 8.95 | 1.03 | 1.8573 | -0.0248 | |||
| AEP / American Electric Power Company, Inc. | 0.10 | 33.98 | 8.92 | 20.91 | 1.8528 | 0.2839 | |||
| MDT / Medtronic plc | 0.10 | 85.54 | 8.85 | 101.43 | 1.8366 | 0.9030 | |||
| CRM / Salesforce, Inc. | 0.04 | -2.31 | 7.49 | 5.87 | 1.5545 | 0.0511 | |||
| NATI / National Instruments Corp. | 0.13 | 42.42 | 7.42 | 55.62 | 1.5414 | 0.5272 | |||
| IBM / International Business Machines Corporation | 0.05 | -4.74 | 7.35 | -3.65 | 1.5256 | -0.0953 | |||
| DHR / Danaher Corporation | 0.03 | -3.20 | 7.32 | -7.46 | 1.4568 | -0.1563 | |||
| CMCSA / Comcast Corporation | 0.17 | -37.53 | 7.29 | -31.21 | 1.5141 | -0.7392 | |||
| EL / The Estée Lauder Companies Inc. | 0.04 | -5.30 | 7.22 | -21.69 | 1.4986 | -0.4607 | |||
| BKR / Baker Hughes Company | 0.23 | -3.65 | 7.17 | 4.84 | 1.4895 | 0.0349 | |||
| HPE / Hewlett Packard Enterprise Company | 0.42 | 18.11 | 7.07 | 24.05 | 1.4682 | 0.2564 | |||
| NEE / NextEra Energy, Inc. | 0.09 | -2.60 | 6.78 | -7.51 | 1.4085 | -0.1507 | |||
| CB / Chubb Limited | 0.03 | -5.11 | 6.65 | -6.89 | 1.3800 | -0.1375 | |||
| CME / CME Group Inc. | 0.03 | -6.51 | 5.66 | -10.83 | 1.1746 | -0.1741 | |||
| ETN / Eaton Corporation plc | 0.03 | -7.90 | 5.31 | 16.62 | 1.1029 | 0.1345 | |||
| CNC / Centene Corporation | 0.07 | 67.56 | 5.00 | 71.62 | 1.0384 | 0.4188 | |||
| ADSK / Autodesk, Inc. | 0.02 | -5.59 | 4.88 | -2.66 | 1.0126 | -0.0524 | |||
| TJX / The TJX Companies, Inc. | 0.05 | -4.63 | 4.57 | 2.93 | 0.9482 | 0.0052 | |||
| SLB / Schlumberger Limited | 0.09 | -5.11 | 4.38 | -7.42 | 0.9098 | -0.0963 | |||
| DIS / The Walt Disney Company | 0.04 | -48.17 | 3.97 | -53.05 | 0.8250 | -0.9740 | |||
| CDW / CDW Corporation | 0.02 | -4.45 | 3.53 | -6.89 | 0.7329 | -0.0728 | |||
| ROK / Rockwell Automation, Inc. | 0.01 | -4.67 | 3.51 | 14.95 | 0.7295 | 0.0799 | |||
| MU / Micron Technology, Inc. | 0.05 | -1.14 | 3.49 | 10.77 | 0.7239 | 0.0549 | |||
| AER / AerCap Holdings N.V. | 0.05 | -5.02 | 3.40 | 11.95 | 0.7063 | 0.0604 | |||
| LVS / Las Vegas Sands Corp. | 0.06 | -4.68 | 3.28 | -1.24 | 0.6807 | -0.0250 | |||
| JCI / Johnson Controls International plc | 0.05 | -4.76 | 3.27 | 15.71 | 0.6791 | 0.1024 | |||
| ROST / Ross Stores, Inc. | 0.03 | -2.14 | 3.22 | 2.16 | 0.6686 | -0.0015 | |||
| ULTA / Ulta Beauty, Inc. | 0.01 | -5.06 | 3.12 | -15.15 | 0.6487 | -0.1341 | |||
| OGN / Organon & Co. | 0.14 | -2.14 | 2.78 | -14.84 | 0.5531 | -0.1124 | |||
| ALNY / Alnylam Pharmaceuticals, Inc. | 0.01 | -6.57 | 2.78 | -11.76 | 0.5767 | -0.0923 | |||
| PSTG / Pure Storage, Inc. | 0.07 | -43.68 | 2.61 | -17.49 | 0.5416 | -0.1304 | |||
| MA / Mastercard Incorporated | 0.01 | 0.00 | 2.35 | 8.29 | 0.4883 | 0.0266 | |||
| UNH / UnitedHealth Group Incorporated | 0.00 | 0.00 | 1.99 | -6.18 | 0.4130 | -0.0376 | |||
| CVX / Chevron Corporation | 0.01 | 0.00 | 1.78 | -7.43 | 0.3698 | -0.0393 | |||
| AVGO / Broadcom Inc. | 0.00 | -12.74 | 1.70 | 21.55 | 0.3527 | 0.0557 | |||
| RACE / Ferrari N.V. | 0.01 | -15.75 | 1.68 | 1.51 | 0.3480 | -0.0031 | |||
| JPM / JPMorgan Chase & Co. | 0.01 | 0.00 | 1.64 | 14.88 | 0.3273 | 0.0354 | |||
| LLY / Eli Lilly and Company | 0.00 | 0.00 | 1.53 | 27.33 | 0.3184 | 0.0625 | |||
| BAC / Bank of America Corporation | 0.05 | 2.74 | 1.46 | 8.53 | 0.3038 | 0.0172 | |||
| COST / Costco Wholesale Corporation | 0.00 | 0.00 | 1.36 | 8.79 | 0.2830 | 0.0168 | |||
| ADI / Analog Devices, Inc. | 0.01 | 0.00 | 1.36 | 2.11 | 0.2820 | -0.0008 | |||
| YUMC / Yum China Holdings, Inc. | 0.02 | -10.58 | 1.31 | -17.83 | 0.2607 | -0.0645 | |||
| CSX / CSX Corporation | 0.04 | 0.00 | 1.29 | 17.21 | 0.2687 | 0.0341 | |||
| MCD / McDonald's Corporation | 0.00 | -6.91 | 1.27 | -2.68 | 0.2637 | -0.0137 | |||
| CSCO / Cisco Systems, Inc. | 0.02 | -84.00 | 1.26 | -84.01 | 0.2622 | -1.4152 | |||
| PEP / PepsiCo, Inc. | 0.01 | 0.00 | 1.21 | 1.00 | 0.2520 | -0.0033 | |||
| SYY / Sysco Corporation | 0.02 | 1.21 | 0.2512 | 0.2512 | |||||
| JNJ / Johnson & Johnson | 0.01 | 10.46 | 1.21 | 8.94 | 0.2504 | 0.0151 | |||
| SYK / Stryker Corporation | 0.00 | -12.43 | 1.20 | -9.42 | 0.2497 | -0.0325 | |||
| C.WSA / Citigroup, Inc. | 0.00 | 0.00 | 1.20 | 5.72 | 0.2497 | 0.0079 | |||
| VLO / Valero Energy Corporation | 0.01 | 0.00 | 1.19 | -13.05 | 0.2477 | -0.0440 | |||
| UNP / Union Pacific Corporation | 0.01 | 0.00 | 1.19 | 6.14 | 0.2476 | 0.0088 | |||
| NKE / NIKE, Inc. | 0.01 | 21.31 | 1.17 | 9.42 | 0.2437 | 0.0158 | |||
| IBN / ICICI Bank Limited - Depositary Receipt (Common Stock) | 0.05 | 0.00 | 1.13 | 7.96 | 0.2339 | 0.0121 | |||
| ACN / Accenture plc | 0.00 | 0.00 | 1.11 | 10.55 | 0.2213 | 0.0162 | |||
| AMGN / Amgen Inc. | 0.00 | 15.84 | 1.11 | 2.88 | 0.2303 | 0.0011 | |||
| SBUX / Starbucks Corporation | 0.01 | 0.00 | 1.07 | -5.47 | 0.2224 | -0.0185 | |||
| TGT / Target Corporation | 0.01 | -78.92 | 1.04 | -82.80 | 0.2164 | -1.0712 | |||
| QCOM / QUALCOMM Incorporated | 0.01 | 0.00 | 1.04 | -2.35 | 0.2161 | -0.0106 | |||
| NTES / NetEase, Inc. - Depositary Receipt (Common Stock) | 0.01 | -23.50 | 1.02 | -14.32 | 0.2113 | -0.0411 | |||
| TCOM / Trip.com Group Limited - Depositary Receipt (Common Stock) | 0.03 | -19.25 | 0.99 | -22.57 | 0.1967 | -0.0638 | |||
| TXN / Texas Instruments Incorporated | 0.01 | 0.00 | 0.98 | 1.45 | 0.2031 | -0.0019 | |||
| PRU / Prudential Financial, Inc. | 0.01 | 0.00 | 0.95 | 7.58 | 0.1976 | 0.0096 | |||
| HDB / HDFC Bank Limited - Depositary Receipt (Common Stock) | 0.01 | 0.00 | 0.86 | 4.24 | 0.1788 | 0.0031 | |||
| JD / JD.com, Inc. - Depositary Receipt (Common Stock) | 0.02 | -8.86 | 0.83 | -20.89 | 0.1731 | -0.0509 | |||
| MMYT / MakeMyTrip Limited | 0.02 | 15.50 | 0.64 | 33.20 | 0.1335 | 0.0309 | |||
| EDU / New Oriental Education & Technology Group Inc. - Depositary Receipt (Common Stock) | 0.02 | -29.29 | 0.64 | -25.56 | 0.1319 | -0.0495 | |||
| INFY / Infosys Limited - Depositary Receipt (Common Stock) | 0.04 | -38.05 | 0.62 | -42.32 | 0.1280 | -0.0992 | |||
| BDX / Becton, Dickinson and Company | 0.00 | -17.84 | 0.60 | -14.45 | 0.1242 | -0.0245 | |||
| ITUB / Itaú Unibanco Holding S.A. - Depositary Receipt (Common Stock) | 0.10 | 0.00 | 0.59 | 23.58 | 0.1221 | 0.0210 | |||
| TMO / Thermo Fisher Scientific Inc. | 0.00 | 81.97 | 0.46 | 63.12 | 0.0957 | 0.0356 | |||
| BAX / Baxter International Inc. | 0.01 | 0.00 | 0.43 | 5.62 | 0.0898 | 0.0028 | |||
| STLA / Stellantis N.V. | 0.01 | 0.00 | 0.24 | 1.24 | 0.0507 | -0.0005 | |||
| ALC / Alcon Inc. | 0.00 | 0.21 | 0.0433 | 0.0433 | |||||
| CNHI / CNH Industrial N.V. | 0.01 | 0.00 | 0.20 | 5.76 | 0.0403 | 0.0013 | |||
| MRNA / Moderna, Inc. | 0.00 | 0.00 | 0.17 | -21.10 | 0.0358 | -0.0108 | |||
| YNDX / Yandex N.V. | 0.01 | 0.00 | 0.16 | 0.00 | 0.0335 | -0.0008 | |||
| TAL / TAL Education Group - Depositary Receipt (Common Stock) | 0.01 | -14.92 | 0.05 | -18.18 | 0.0108 | -0.0028 | |||
| ALL / The Allstate Corporation | 0.00 | -100.00 | 0.00 | -100.00 | -0.0757 | ||||
| BIDU / Baidu, Inc. - Depositary Receipt (Common Stock) | 0.00 | -100.00 | 0.00 | -100.00 | -0.0200 | ||||
| UBS / UBS Group AG | 0.00 | -100.00 | 0.00 | -100.00 | -0.0454 | ||||
| IQV / IQVIA Holdings Inc. | 0.00 | -100.00 | 0.00 | -100.00 | -0.7194 | ||||
| SPR / Spirit AeroSystems Holdings, Inc. | 0.00 | -100.00 | 0.00 | -100.00 | -0.7420 | ||||
| CTSH / Cognizant Technology Solutions Corporation | 0.00 | -100.00 | 0.00 | -100.00 | -0.7574 | ||||
| BABA / Alibaba Group Holding Limited - Depositary Receipt (Common Stock) | 0.00 | -100.00 | 0.00 | -100.00 | -0.3431 | ||||
| TFC / Truist Financial Corporation | 0.00 | -100.00 | 0.00 | -100.00 | -0.2067 |