Basic Stats
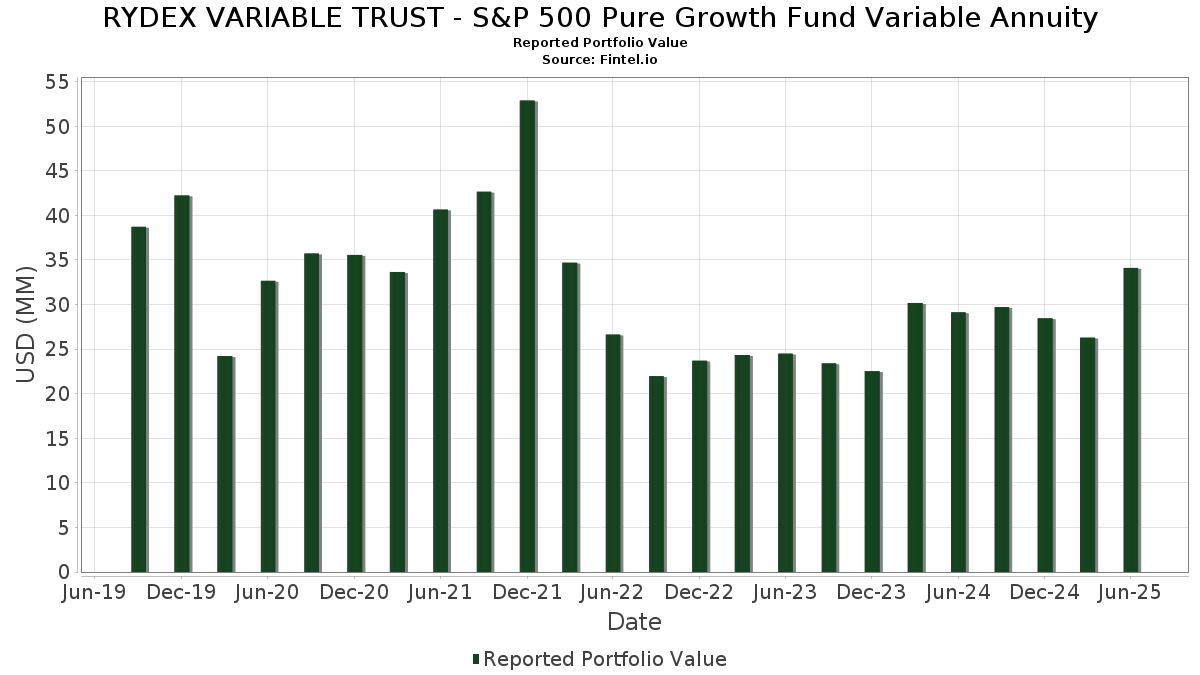
| Portfolio Value | $ 34,107,772 |
| Current Positions | 93 |
Latest Holdings, Performance, AUM (from 13F, 13D)
RYDEX VARIABLE TRUST - S&P 500 Pure Growth Fund Variable Annuity has disclosed 93 total holdings in their latest SEC filings. Most recent portfolio value is calculated to be $ 34,107,772 USD. Actual Assets Under Management (AUM) is this value plus cash (which is not disclosed). RYDEX VARIABLE TRUST - S&P 500 Pure Growth Fund Variable Annuity’s top holdings are Royal Caribbean Cruises Ltd. (US:RCL) , Vistra Corp. (US:VST) , Palantir Technologies Inc. (US:PLTR) , Axon Enterprise, Inc. (US:AXON) , and Carnival Corporation & plc (US:CCL) .
Top Increases This Quarter
We use the change in the portfolio allocation because this is the most meaningful metric. Changes can be due to trades or changes in share prices.
| Security | Shares (MM) |
Value (MM$) |
Portfolio % | ΔPortfolio % |
|---|---|---|---|---|
| 0.00 | 0.88 | 2.4831 | 0.6411 | |
| 0.01 | 0.83 | 2.3405 | 0.5668 | |
| 0.00 | 0.89 | 2.5212 | 0.4964 | |
| 0.00 | 0.78 | 2.1995 | 0.4890 | |
| 0.00 | 0.63 | 1.7843 | 0.4855 | |
| 0.00 | 0.52 | 1.4599 | 0.3741 | |
| 0.00 | 0.43 | 1.2222 | 0.3588 | |
| 0.03 | 0.78 | 2.1898 | 0.3283 | |
| 0.00 | 0.73 | 2.0469 | 0.3280 | |
| 0.00 | 0.60 | 1.6932 | 0.3002 |
Top Decreases This Quarter
We use the change in the portfolio allocation because this is the most meaningful metric. Changes can be due to trades or changes in share prices.
| Security | Shares (MM) |
Value (MM$) |
Portfolio % | ΔPortfolio % |
|---|---|---|---|---|
| 0.00 | 0.50 | 1.4091 | -0.7530 | |
| 0.00 | 0.25 | 0.7060 | -0.4012 | |
| 0.00 | 0.25 | 0.7032 | -0.3378 | |
| 0.00 | 0.27 | 0.7634 | -0.3140 | |
| 0.00 | 0.26 | 0.7472 | -0.3062 | |
| 0.00 | 0.28 | 0.8007 | -0.2989 | |
| 0.00 | 0.35 | 0.9911 | -0.2959 | |
| 0.00 | 0.35 | 0.9832 | -0.2882 | |
| 0.00 | 0.34 | 0.9573 | -0.2741 | |
| 0.00 | 0.49 | 1.3747 | -0.2497 |
13F and Fund Filings
This form was filed on 2025-08-27 for the reporting period 2025-06-30. Click the link icon to see the full transaction history.
Upgrade to unlock premium data and export to Excel ![]() .
.
| Security | Type | Avg Share Price | Shares (MM) |
ΔShares (%) |
ΔShares (%) |
Value ($MM) |
Portfolio (%) |
ΔPortfolio (%) |
|
|---|---|---|---|---|---|---|---|---|---|
| RCL / Royal Caribbean Cruises Ltd. | 0.00 | 10.70 | 0.89 | 69.00 | 2.5212 | 0.4964 | |||
| VST / Vistra Corp. | 0.00 | 10.70 | 0.88 | 82.95 | 2.4831 | 0.6411 | |||
| PLTR / Palantir Technologies Inc. | 0.01 | 10.71 | 0.83 | 78.66 | 2.3405 | 0.5668 | |||
| AXON / Axon Enterprise, Inc. | 0.00 | 10.69 | 0.78 | 74.27 | 2.1995 | 0.4890 | |||
| CCL / Carnival Corporation & plc | 0.03 | 10.72 | 0.78 | 59.34 | 2.1898 | 0.3283 | |||
| NVDA / NVIDIA Corporation | 0.00 | 10.70 | 0.73 | 61.47 | 2.0469 | 0.3280 | |||
| HWM / Howmet Aerospace Inc. | 0.00 | 10.68 | 0.72 | 58.72 | 2.0298 | 0.2976 | |||
| NRG / NRG Energy, Inc. | 0.00 | 10.67 | 0.63 | 86.43 | 1.7843 | 0.4855 | |||
| TKO / TKO Group Holdings, Inc. | 0.00 | 10.70 | 0.62 | 31.84 | 1.7415 | -0.0490 | |||
| CRWD / CrowdStrike Holdings, Inc. | 0.00 | 10.67 | 0.61 | 59.74 | 1.7135 | 0.2610 | |||
| NCLH / Norwegian Cruise Line Holdings Ltd. | 0.03 | 10.71 | 0.60 | 18.54 | 1.6958 | -0.2447 | |||
| PWR / Quanta Services, Inc. | 0.00 | 10.74 | 0.60 | 64.84 | 1.6932 | 0.3002 | |||
| FTNT / Fortinet, Inc. | 0.01 | 10.72 | 0.60 | 21.63 | 1.6815 | -0.1924 | |||
| UAL / United Airlines Holdings, Inc. | 0.01 | 10.72 | 0.59 | 27.92 | 1.6672 | -0.1022 | |||
| LYV / Live Nation Entertainment, Inc. | 0.00 | 10.68 | 0.59 | 28.48 | 1.6668 | -0.0947 | |||
| BKNG / Booking Holdings Inc. | 0.00 | 10.00 | 0.57 | 38.41 | 1.6163 | 0.0318 | |||
| ANET / Arista Networks Inc | 0.01 | 10.72 | 0.57 | 46.15 | 1.6097 | 0.1177 | |||
| UBER / Uber Technologies, Inc. | 0.01 | 10.70 | 0.57 | 41.96 | 1.5948 | 0.0703 | |||
| DASH / DoorDash, Inc. | 0.00 | 10.73 | 0.55 | 49.18 | 1.5419 | 0.1429 | |||
| AVGO / Broadcom Inc. | 0.00 | 10.67 | 0.52 | 82.04 | 1.4599 | 0.3741 | |||
| TPL / Texas Pacific Land Corporation | 0.00 | 10.77 | 0.50 | -11.68 | 1.4091 | -0.7530 | |||
| APO / Apollo Global Management, Inc. | 0.00 | 10.70 | 0.49 | 14.59 | 1.3747 | -0.2497 | |||
| TPR / Tapestry, Inc. | 0.01 | 10.71 | 0.48 | 38.11 | 1.3595 | 0.0252 | |||
| HLT / Hilton Worldwide Holdings Inc. | 0.00 | 10.64 | 0.48 | 29.70 | 1.3430 | -0.0623 | |||
| DAL / Delta Air Lines, Inc. | 0.01 | 10.71 | 0.47 | 24.73 | 1.3245 | -0.1128 | |||
| URI / United Rentals, Inc. | 0.00 | 10.77 | 0.46 | 32.95 | 1.3109 | -0.0231 | |||
| NFLX / Netflix, Inc. | 0.00 | 10.67 | 0.44 | 59.14 | 1.2538 | 0.1847 | |||
| AXP / American Express Company | 0.00 | 10.70 | 0.44 | 31.02 | 1.2288 | -0.0400 | |||
| GEV / GE Vernova Inc. | 0.00 | 10.68 | 0.43 | 92.44 | 1.2222 | 0.3588 | |||
| TT / Trane Technologies plc | 0.00 | 10.64 | 0.42 | 43.64 | 1.1805 | 0.0668 | |||
| META / Meta Platforms, Inc. | 0.00 | 10.74 | 0.41 | 42.21 | 1.1594 | 0.0515 | |||
| SMCI / Super Micro Computer, Inc. | 0.01 | 10.72 | 0.41 | 58.59 | 1.1466 | 0.1662 | |||
| PODD / Insulet Corporation | 0.00 | 10.75 | 0.40 | 32.34 | 1.1323 | -0.0258 | |||
| MAR / Marriott International, Inc. | 0.00 | 10.71 | 0.40 | 27.16 | 1.1234 | -0.0755 | |||
| EXPE / Expedia Group, Inc. | 0.00 | 10.69 | 0.38 | 10.95 | 1.0589 | -0.2330 | |||
| RL / Ralph Lauren Corporation | 0.00 | 10.65 | 0.37 | 37.64 | 1.0527 | 0.0151 | |||
| WYNN / Wynn Resorts, Limited | 0.00 | 10.69 | 0.37 | 24.32 | 1.0397 | -0.0950 | |||
| GDDY / GoDaddy Inc. | 0.00 | 10.69 | 0.37 | 10.88 | 1.0359 | -0.2329 | |||
| SYF / Synchrony Financial | 0.01 | 10.73 | 0.36 | 39.77 | 1.0214 | 0.0299 | |||
| FICO / Fair Isaac Corporation | 0.00 | 10.29 | 0.35 | 9.32 | 0.9949 | -0.2384 | |||
| PGR / The Progressive Corporation | 0.00 | 10.67 | 0.35 | 4.46 | 0.9911 | -0.2959 | |||
| ACGL / Arch Capital Group Ltd. | 0.00 | 10.70 | 0.35 | 4.82 | 0.9832 | -0.2882 | |||
| NOW / ServiceNow, Inc. | 0.00 | 10.82 | 0.35 | 43.39 | 0.9800 | 0.0520 | |||
| CEG / Constellation Energy Corporation | 0.00 | 10.70 | 0.34 | 77.08 | 0.9603 | 0.2260 | |||
| CPAY / Corpay, Inc. | 0.00 | 10.71 | 0.34 | 5.28 | 0.9573 | -0.2741 | |||
| AMP / Ameriprise Financial, Inc. | 0.00 | 10.72 | 0.32 | 22.22 | 0.9016 | -0.0993 | |||
| CBRE / CBRE Group, Inc. | 0.00 | 10.68 | 0.31 | 18.77 | 0.8761 | -0.1250 | |||
| WAB / Westinghouse Air Brake Technologies Corporation | 0.00 | 10.67 | 0.31 | 27.57 | 0.8756 | -0.0531 | |||
| PHM / PulteGroup, Inc. | 0.00 | 10.70 | 0.31 | 13.60 | 0.8735 | -0.1688 | |||
| IRM / Iron Mountain Incorporated | 0.00 | 10.67 | 0.30 | 32.17 | 0.8582 | -0.0233 | |||
| PAYC / Paycom Software, Inc. | 0.00 | 10.69 | 0.30 | 17.37 | 0.8581 | -0.1338 | |||
| ISRG / Intuitive Surgical, Inc. | 0.00 | 10.60 | 0.30 | 21.46 | 0.8475 | -0.0989 | |||
| APH / Amphenol Corporation | 0.00 | 10.69 | 0.30 | 67.23 | 0.8363 | 0.1563 | |||
| CAT / Caterpillar Inc. | 0.00 | 10.77 | 0.30 | 30.53 | 0.8331 | -0.0327 | |||
| BRO / Brown & Brown, Inc. | 0.00 | 10.72 | 0.28 | -1.39 | 0.8007 | -0.2989 | |||
| TDG / TransDigm Group Incorporated | 0.00 | 10.78 | 0.28 | 21.65 | 0.7934 | -0.0895 | |||
| TSLA / Tesla, Inc. | 0.00 | 10.65 | 0.28 | 35.78 | 0.7821 | 0.0006 | |||
| HES / Hess Corporation | 0.00 | 10.71 | 0.27 | -3.91 | 0.7634 | -0.3140 | |||
| LVS / Las Vegas Sands Corp. | 0.01 | 10.73 | 0.27 | 24.65 | 0.7575 | -0.0656 | |||
| TRGP / Targa Resources Corp. | 0.00 | 10.69 | 0.26 | -4.00 | 0.7472 | -0.3062 | |||
| HUBB / Hubbell Incorporated | 0.00 | 10.69 | 0.26 | 37.17 | 0.7394 | 0.0060 | |||
| CMI / Cummins Inc. | 0.00 | 10.57 | 0.26 | 15.56 | 0.7343 | -0.1270 | |||
| BSX / Boston Scientific Corporation | 0.00 | 10.69 | 0.25 | 17.76 | 0.7118 | -0.1066 | |||
| FI / Fiserv, Inc. | 0.00 | 10.67 | 0.25 | -13.49 | 0.7060 | -0.4012 | |||
| CTAS / Cintas Corporation | 0.00 | 10.75 | 0.25 | 20.19 | 0.7058 | -0.0906 | |||
| ORCL / Oracle Corporation | 0.00 | 10.65 | 0.25 | 72.92 | 0.7047 | 0.1528 | |||
| ERIE / Erie Indemnity Company | 0.00 | 10.62 | 0.25 | -8.46 | 0.7032 | -0.3378 | |||
| DECK / Deckers Outdoor Corporation | 0.00 | 10.73 | 0.24 | 2.10 | 0.6869 | -0.2250 | |||
| PANW / Palo Alto Networks, Inc. | 0.00 | 10.70 | 0.24 | 32.78 | 0.6746 | -0.0140 | |||
| RMD / ResMed Inc. | 0.00 | 10.72 | 0.24 | 28.11 | 0.6687 | -0.0414 | |||
| IBM / International Business Machines Corporation | 0.00 | 10.65 | 0.24 | 31.28 | 0.6651 | -0.0220 | |||
| V / Visa Inc. | 0.00 | 10.62 | 0.23 | 12.25 | 0.6468 | -0.1353 | |||
| PH / Parker-Hannifin Corporation | 0.00 | 10.65 | 0.22 | 27.27 | 0.6343 | -0.0417 | |||
| MA / Mastercard Incorporated | 0.00 | 10.66 | 0.22 | 13.16 | 0.6085 | -0.1183 | |||
| DVA / DaVita Inc. | 0.00 | 10.70 | 0.21 | 2.94 | 0.5942 | -0.1869 | |||
| GWW / W.W. Grainger, Inc. | 0.00 | 10.80 | 0.20 | 16.76 | 0.5721 | -0.0924 | |||
| GRMN / Garmin Ltd. | 0.00 | 10.65 | 0.19 | 6.63 | 0.5445 | -0.1492 | |||
| ABNB / Airbnb, Inc. | 0.00 | 10.65 | 0.19 | 22.73 | 0.5352 | -0.0565 | |||
| ETN / Eaton Corporation plc | 0.00 | 10.76 | 0.19 | 46.09 | 0.5285 | 0.0361 | |||
| CMG / Chipotle Mexican Grill, Inc. | 0.00 | 10.71 | 0.19 | 24.00 | 0.5270 | -0.0498 | |||
| RSG / Republic Services, Inc. | 0.00 | 10.72 | 0.19 | 12.80 | 0.5244 | -0.1058 | |||
| IR / Ingersoll Rand Inc. | 0.00 | 10.71 | 0.18 | 15.72 | 0.5191 | -0.0923 | |||
| TYL / Tyler Technologies, Inc. | 0.00 | 10.62 | 0.18 | 13.29 | 0.5049 | -0.1017 | |||
| LII / Lennox International Inc. | 0.00 | 10.64 | 0.18 | 12.66 | 0.5044 | -0.1000 | |||
| COST / Costco Wholesale Corporation | 0.00 | 10.49 | 0.18 | 15.69 | 0.4997 | -0.0858 | |||
| MSI / Motorola Solutions, Inc. | 0.00 | 10.68 | 0.16 | 6.12 | 0.4423 | -0.1216 | |||
| LLY / Eli Lilly and Company | 0.00 | 11.05 | 0.15 | 4.23 | 0.4199 | -0.1230 | |||
| WSM / Williams-Sonoma, Inc. | 0.00 | 10.72 | 0.14 | 14.40 | 0.4045 | -0.0746 | |||
| CRM / Salesforce, Inc. | 0.00 | 10.68 | 0.12 | 12.73 | 0.3507 | -0.0719 | |||
| DAY / Dayforce Inc. | 0.00 | 10.67 | 0.11 | 5.61 | 0.3191 | -0.0924 | |||
| DE000C4SA6R6 / EURO STOXX 50 Index | 0.09 | 0.2609 | 0.2609 | ||||||
| Barclays Capital, Inc. / RA (N/A) | 0.04 | 0.1126 | 0.1126 | ||||||
| BofA Securities, Inc. / RA (N/A) | 0.04 | 0.1087 | 0.1087 |