Basic Stats
| Portfolio Value | $ 3,124,440 |
| Current Positions | 39 |
Latest Holdings, Performance, AUM (from 13F, 13D)
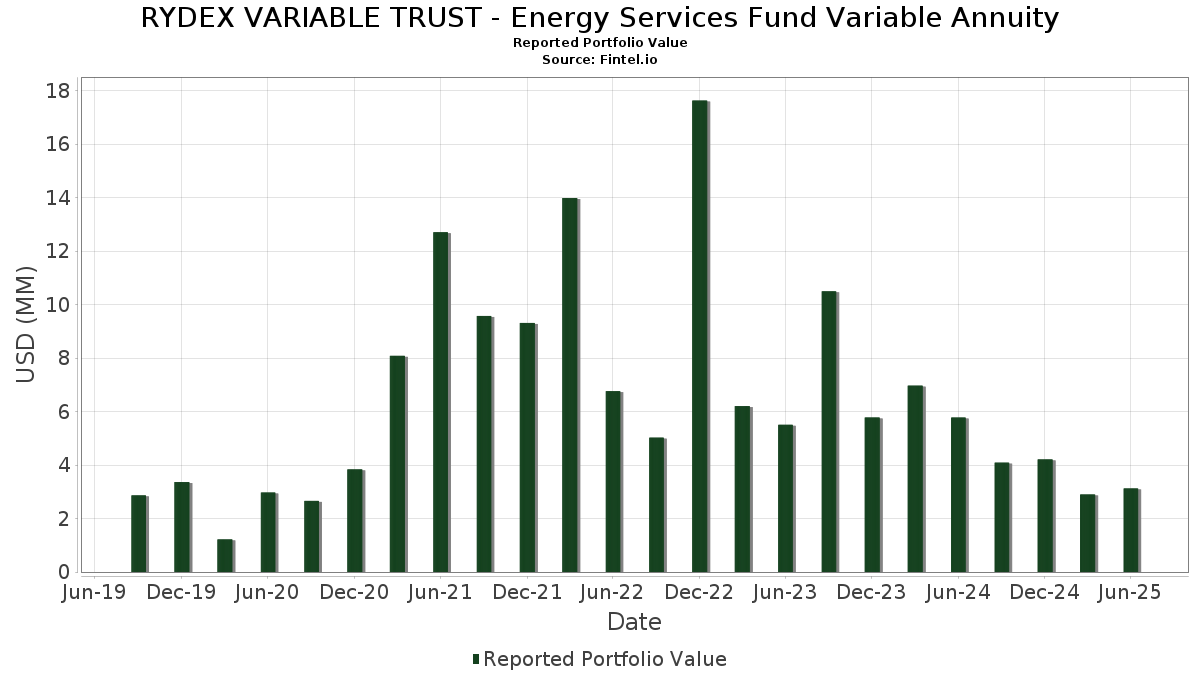
RYDEX VARIABLE TRUST - Energy Services Fund Variable Annuity has disclosed 39 total holdings in their latest SEC filings. Most recent portfolio value is calculated to be $ 3,124,440 USD. Actual Assets Under Management (AUM) is this value plus cash (which is not disclosed). RYDEX VARIABLE TRUST - Energy Services Fund Variable Annuity’s top holdings are Schlumberger Limited (US:SLB) , Baker Hughes Company (US:BKR) , Halliburton Company (US:HAL) , TechnipFMC plc (CH:FTI) , and ChampionX Corporation (US:CHX) .
Top Increases This Quarter
We use the change in the portfolio allocation because this is the most meaningful metric. Changes can be due to trades or changes in share prices.
| Security | Shares (MM) |
Value (MM$) |
Portfolio % | ΔPortfolio % |
|---|---|---|---|---|
| 0.05 | 0.05 | 1.6696 | 1.6696 | |
| 0.05 | 0.05 | 1.6696 | 1.6696 | |
| 0.01 | 0.35 | 11.6815 | 1.4645 | |
| 0.01 | 0.38 | 12.5576 | 0.9603 | |
| 0.00 | 0.08 | 2.5808 | 0.9284 | |
| 0.00 | 0.10 | 3.3001 | 0.6020 | |
| 0.00 | 0.06 | 2.0856 | 0.5453 | |
| 0.00 | 0.12 | 3.9373 | 0.5264 | |
| 0.00 | 0.10 | 3.2370 | 0.5132 | |
| 0.00 | 0.10 | 3.5023 | 0.4887 |
Top Decreases This Quarter
We use the change in the portfolio allocation because this is the most meaningful metric. Changes can be due to trades or changes in share prices.
| Security | Shares (MM) |
Value (MM$) |
Portfolio % | ΔPortfolio % |
|---|---|---|---|---|
| 0.02 | 0.06 | 2.1507 | -0.5178 | |
| 0.00 | 0.06 | 1.9877 | -0.3501 | |
| 0.02 | 0.03 | 1.1620 | -0.2336 | |
| 0.01 | 0.07 | 2.3929 | -0.1652 | |
| 0.01 | 0.05 | 1.6881 | -0.0833 | |
| 0.00 | 0.07 | 2.2246 | -0.0767 | |
| 0.01 | 0.08 | 2.7404 | -0.0453 | |
| 0.00 | 0.05 | 1.7762 | -0.0233 |
13F and Fund Filings
This form was filed on 2025-08-27 for the reporting period 2025-06-30. Click the link icon to see the full transaction history.
Upgrade to unlock premium data and export to Excel ![]() .
.
| Security | Type | Avg Share Price | Shares (MM) |
ΔShares (%) |
ΔShares (%) |
Value ($MM) |
Portfolio (%) |
ΔPortfolio (%) |
|
|---|---|---|---|---|---|---|---|---|---|
| SLB / Schlumberger Limited | 0.01 | 29.43 | 0.38 | 4.46 | 12.5576 | 0.9603 | |||
| BKR / Baker Hughes Company | 0.01 | 26.68 | 0.35 | 10.44 | 11.6815 | 1.4645 | |||
| HAL / Halliburton Company | 0.01 | 27.44 | 0.22 | 2.35 | 7.2858 | 0.4067 | |||
| FTI / TechnipFMC plc | 0.00 | -9.04 | 0.12 | -1.64 | 4.0404 | 0.0898 | |||
| CHX / ChampionX Corporation | 0.00 | 25.97 | 0.12 | 5.31 | 3.9887 | 0.3171 | |||
| AROC / Archrock, Inc. | 0.00 | 17.91 | 0.12 | 11.43 | 3.9373 | 0.5264 | |||
| NOV / NOV Inc. | 0.01 | 22.25 | 0.12 | -0.85 | 3.9031 | 0.1245 | |||
| WFRD / Weatherford International plc | 0.00 | 19.56 | 0.10 | 11.83 | 3.5023 | 0.4887 | |||
| WHD / Cactus, Inc. | 0.00 | 17.63 | 0.10 | 12.09 | 3.4306 | 0.4755 | |||
| NE / Noble Corporation plc | 0.00 | 5.53 | 0.10 | 18.07 | 3.3001 | 0.6020 | |||
| TS / Tenaris S.A. - Depositary Receipt (Common Stock) | 0.00 | 20.12 | 0.10 | 14.29 | 3.2370 | 0.5132 | |||
| VAL / Valaris Limited | 0.00 | 7.87 | 0.08 | 15.07 | 2.8344 | 0.4665 | |||
| PTEN / Patterson-UTI Energy, Inc. | 0.01 | 31.80 | 0.08 | -4.65 | 2.7404 | -0.0453 | |||
| OII / Oceaneering International, Inc. | 0.00 | 16.64 | 0.08 | 11.27 | 2.6495 | 0.3384 | |||
| KGS / Kodiak Gas Services, Inc. | 0.00 | 27.53 | 0.08 | 17.91 | 2.6410 | 0.4624 | |||
| TDW / Tidewater Inc. | 0.00 | 5.19 | 0.08 | 14.93 | 2.5934 | 0.4097 | |||
| SEI / Solaris Energy Infrastructure, Inc. | 0.00 | 16.11 | 0.08 | 50.98 | 2.5808 | 0.9284 | |||
| LBRT / Liberty Energy Inc. | 0.01 | 24.68 | 0.07 | -10.13 | 2.3929 | -0.1652 | |||
| SDRL / Seadrill Limited | 0.00 | -11.01 | 0.07 | -7.04 | 2.2246 | -0.0767 | |||
| RIG / Transocean Ltd. | 0.02 | -4.65 | 0.06 | -21.95 | 2.1507 | -0.5178 | |||
| ARIS / Aris Water Solutions, Inc. | 0.00 | 77.30 | 0.06 | 31.91 | 2.0856 | 0.5453 | |||
| HP / Helmerich & Payne, Inc. | 0.00 | 41.59 | 0.06 | -18.06 | 1.9877 | -0.3501 | |||
| AESI / Atlas Energy Solutions Inc. | 0.00 | 27.30 | 0.05 | -3.64 | 1.7762 | -0.0233 | |||
| XPRO / Expro Group Holdings N.V. | 0.01 | 28.91 | 0.05 | 11.11 | 1.6930 | 0.2240 | |||
| WTTR / Select Water Solutions, Inc. | 0.01 | 11.94 | 0.05 | -7.41 | 1.6881 | -0.0833 | |||
| HLX / Helix Energy Solutions Group, Inc. | 0.01 | 30.17 | 0.05 | -1.96 | 1.6757 | 0.0186 | |||
| First American Government Obligations Fund - Class X / STIV (N/A) | 0.05 | 0.05 | 1.6696 | 1.6696 | |||||
| First American Government Obligations Fund - Class X / STIV (N/A) | 0.05 | 0.05 | 1.6696 | 1.6696 | |||||
| PUMP / ProPetro Holding Corp. | 0.01 | 27.05 | 0.04 | 2.63 | 1.3340 | 0.0845 | |||
| RES / RPC, Inc. | 0.01 | 28.78 | 0.04 | 11.76 | 1.2888 | 0.1640 | |||
| BORR / Borr Drilling Limited | 0.02 | -3.69 | 0.03 | -20.93 | 1.1620 | -0.2336 | |||
| NBR / Nabors Industries Ltd. | 0.00 | 89.60 | 0.02 | 28.57 | 0.6140 | 0.1480 | |||
| ACDC / ProFrac Holding Corp. | 0.00 | 44.49 | 0.02 | 45.45 | 0.5641 | 0.1950 | |||
| DE000C4SA6R6 / EURO STOXX 50 Index | 0.01 | 0.4032 | 0.4032 | ||||||
| DE000C4SA6R6 / EURO STOXX 50 Index | 0.01 | 0.4032 | 0.4032 | ||||||
| Barclays Capital, Inc. / RA (N/A) | 0.01 | 0.1740 | 0.1740 | ||||||
| Barclays Capital, Inc. / RA (N/A) | 0.01 | 0.1740 | 0.1740 | ||||||
| BofA Securities, Inc. / RA (N/A) | 0.01 | 0.1680 | 0.1680 | ||||||
| BofA Securities, Inc. / RA (N/A) | 0.01 | 0.1680 | 0.1680 |