Basic Stats
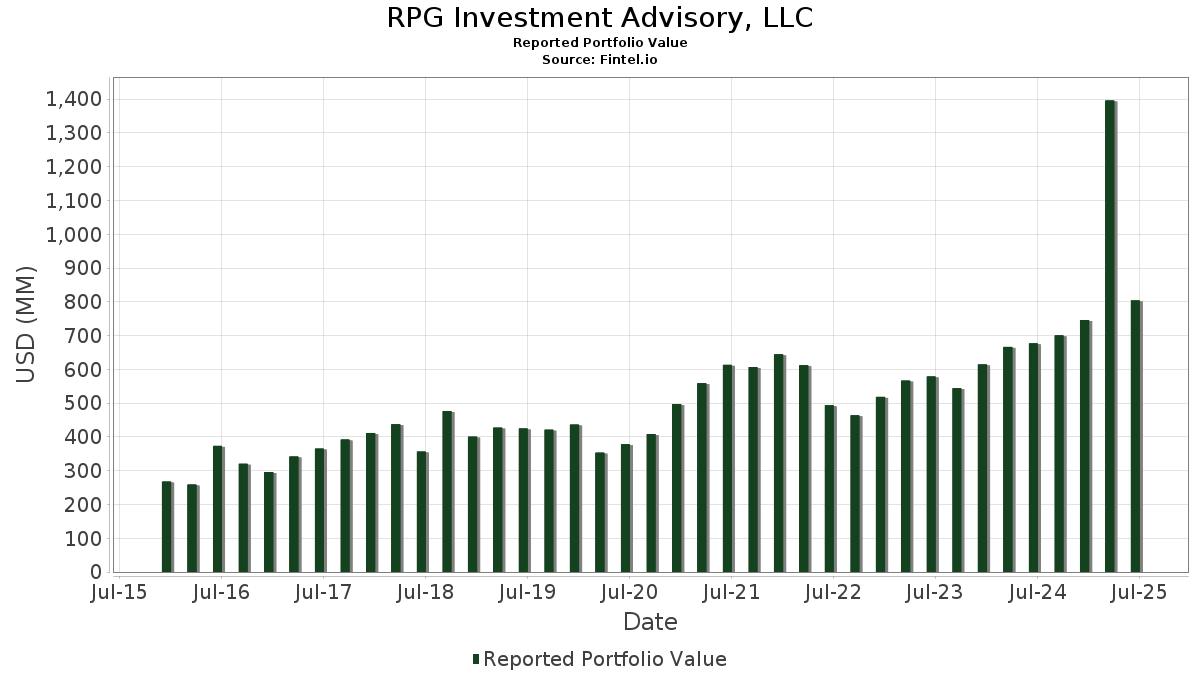
| Portfolio Value | $ 803,921,648 |
| Current Positions | 85 |
Latest Holdings, Performance, AUM (from 13F, 13D)
RPG Investment Advisory, LLC has disclosed 85 total holdings in their latest SEC filings. Most recent portfolio value is calculated to be $ 803,921,648 USD. Actual Assets Under Management (AUM) is this value plus cash (which is not disclosed). RPG Investment Advisory, LLC’s top holdings are NVIDIA Corporation (US:NVDA) , Microsoft Corporation (US:MSFT) , Amazon.com, Inc. (US:AMZN) , Alphabet Inc. (US:GOOG) , and Palantir Technologies Inc. (US:PLTR) . RPG Investment Advisory, LLC’s new positions include CrowdStrike Holdings, Inc. (US:CRWD) , Peabody Energy Corporation (US:BTU) , SoFi Technologies, Inc. (US:SOFI) , .
Top Increases This Quarter
We use the change in the portfolio allocation because this is the most meaningful metric. Changes can be due to trades or changes in share prices.
| Security | Shares (MM) |
Value (MM$) |
Portfolio % | ΔPortfolio % |
|---|---|---|---|---|
| 0.02 | 10.57 | 1.3146 | 1.3146 | |
| 0.61 | 8.24 | 1.0253 | 1.0253 | |
| 0.38 | 59.34 | 7.3817 | 1.0047 | |
| 0.13 | 29.36 | 3.6520 | 0.8577 | |
| 0.06 | 23.51 | 2.9242 | 0.6688 | |
| 0.51 | 25.14 | 3.1275 | 0.6251 | |
| 0.16 | 22.47 | 2.7948 | 0.6020 | |
| 0.20 | 27.67 | 3.4417 | 0.5920 | |
| 0.06 | 30.84 | 3.8367 | 0.5031 | |
| 0.13 | 18.83 | 2.3427 | 0.4038 |
Top Decreases This Quarter
We use the change in the portfolio allocation because this is the most meaningful metric. Changes can be due to trades or changes in share prices.
| Security | Shares (MM) |
Value (MM$) |
Portfolio % | ΔPortfolio % |
|---|---|---|---|---|
| 0.00 | 0.33 | 0.0416 | -1.5225 | |
| 0.21 | 8.15 | 1.0135 | -1.1473 | |
| 0.12 | 25.09 | 3.1214 | -0.7863 | |
| 0.12 | 16.57 | 2.0617 | -0.7292 | |
| 0.46 | 6.88 | 0.8564 | -0.4691 | |
| 0.07 | 10.30 | 1.2807 | -0.4375 | |
| 0.09 | 7.78 | 0.9682 | -0.3214 | |
| 0.26 | 8.23 | 1.0232 | -0.3181 | |
| 0.16 | 13.57 | 1.6884 | -0.3086 | |
| 0.03 | 5.82 | 0.7240 | -0.2240 |
13F and Fund Filings
This form was filed on 2025-08-12 for the reporting period 2025-06-30. Click the link icon to see the full transaction history.
Upgrade to unlock premium data and export to Excel ![]() .
.
| Security | Type | Avg Share Price | Shares (MM) |
ΔShares (%) |
ΔShares (%) |
Value ($MM) |
Portfolio (%) |
ΔPortfolio (%) |
|
|---|---|---|---|---|---|---|---|---|---|
| NVDA / NVIDIA Corporation | 0.38 | -54.27 | 59.34 | -33.34 | 7.3817 | 1.0047 | |||
| MSFT / Microsoft Corporation | 0.06 | -49.98 | 30.84 | -33.72 | 3.8367 | 0.5031 | |||
| AMZN / Amazon.com, Inc. | 0.13 | -34.72 | 29.36 | -24.73 | 3.6520 | 0.8577 | |||
| GOOG / Alphabet Inc. | 0.16 | -49.99 | 29.19 | -43.22 | 3.6311 | -0.0520 | |||
| PLTR / Palantir Technologies Inc. | 0.20 | -56.94 | 27.67 | -30.45 | 3.4417 | 0.5920 | |||
| SMCI / Super Micro Computer, Inc. | 0.51 | -49.71 | 25.14 | -28.02 | 3.1275 | 0.6251 | |||
| AAPL / Apple Inc. | 0.12 | -50.20 | 25.09 | -54.00 | 3.1214 | -0.7863 | |||
| PWR / Quanta Services, Inc. | 0.06 | -49.80 | 23.51 | -25.33 | 2.9242 | 0.6688 | |||
| RTX / RTX Corporation | 0.16 | -50.74 | 23.38 | -45.70 | 2.9087 | -0.1760 | |||
| BWXT / BWX Technologies, Inc. | 0.16 | -49.74 | 22.47 | -26.60 | 2.7948 | 0.6020 | |||
| FTNT / Fortinet, Inc. | 0.21 | -49.83 | 22.36 | -44.90 | 2.7818 | -0.1255 | |||
| GVA / Granite Construction Incorporated | 0.24 | -49.87 | 22.15 | -37.83 | 2.7556 | 0.2030 | |||
| NET / Cloudflare, Inc. | 0.11 | -62.16 | 22.00 | -34.24 | 2.7366 | 0.3401 | |||
| NOW / ServiceNow, Inc. | 0.02 | -49.60 | 20.29 | -34.92 | 2.5244 | 0.2906 | |||
| AMD / Advanced Micro Devices, Inc. | 0.13 | -49.62 | 18.83 | -30.42 | 2.3427 | 0.4038 | |||
| JCI / Johnson Controls International plc | 0.17 | -55.44 | 18.42 | -41.25 | 2.2909 | 0.0452 | |||
| ISRG / Intuitive Surgical, Inc. | 0.03 | -49.49 | 17.96 | -44.58 | 2.2343 | -0.0875 | |||
| XYL / Xylem Inc. | 0.13 | -49.72 | 17.27 | -45.56 | 2.1483 | -0.1242 | |||
| CVX / Chevron Corporation | 0.12 | -50.30 | 16.57 | -57.46 | 2.0617 | -0.7292 | |||
| POWL / Powell Industries, Inc. | 0.08 | -49.15 | 16.49 | -37.18 | 2.0515 | 0.1708 | |||
| FCX / Freeport-McMoRan Inc. | 0.34 | -37.42 | 14.58 | -28.34 | 1.8137 | 0.3560 | |||
| IBM / International Business Machines Corporation | 0.05 | -49.95 | 14.49 | -40.67 | 1.8020 | 0.0529 | |||
| LHX / L3Harris Technologies, Inc. | 0.06 | -49.48 | 14.13 | -39.46 | 1.7571 | 0.0857 | |||
| ZS / Zscaler, Inc. | 0.04 | -62.49 | 13.95 | -40.66 | 1.7347 | 0.0512 | |||
| MDT / Medtronic plc | 0.16 | -49.81 | 13.57 | -51.31 | 1.6884 | -0.3086 | |||
| JPM / JPMorgan Chase & Co. | 0.05 | -49.66 | 13.22 | -40.50 | 1.6449 | 0.0528 | |||
| CRM / Salesforce, Inc. | 0.05 | -38.07 | 13.21 | -37.07 | 1.6429 | 0.1394 | |||
| SSYS / Stratasys Ltd. | 1.11 | -49.49 | 12.73 | -40.83 | 1.5838 | 0.0424 | |||
| GS / The Goldman Sachs Group, Inc. | 0.02 | -49.36 | 11.84 | -34.39 | 1.4731 | 0.1800 | |||
| CSCO / Cisco Systems, Inc. | 0.15 | -49.91 | 10.69 | -43.68 | 1.3300 | -0.0301 | |||
| BA / The Boeing Company | 0.05 | -50.13 | 10.69 | -38.73 | 1.3293 | 0.0799 | |||
| CRWD / CrowdStrike Holdings, Inc. | 0.02 | 10.57 | 1.3146 | 1.3146 | |||||
| UGI / UGI Corporation | 0.29 | -50.23 | 10.54 | -45.19 | 1.3109 | -0.0665 | |||
| BAC / Bank of America Corporation | 0.22 | -49.90 | 10.53 | -43.18 | 1.3096 | -0.0179 | |||
| FANG / Diamondback Energy, Inc. | 0.07 | -50.05 | 10.30 | -57.08 | 1.2807 | -0.4375 | |||
| PYPL / PayPal Holdings, Inc. | 0.13 | -49.60 | 9.94 | -42.60 | 1.2367 | -0.0041 | |||
| NVO / Novo Nordisk A/S - Depositary Receipt (Common Stock) | 0.13 | -27.13 | 9.31 | -27.57 | 1.1583 | 0.2373 | |||
| OKTA / Okta, Inc. | 0.09 | -47.97 | 9.14 | -50.57 | 1.1373 | -0.1876 | |||
| BTU / Peabody Energy Corporation | 0.61 | 8.24 | 1.0253 | 1.0253 | |||||
| DVN / Devon Energy Corporation | 0.26 | -48.35 | 8.23 | -56.07 | 1.0232 | -0.3181 | |||
| SBUX / Starbucks Corporation | 0.09 | -49.30 | 8.16 | -52.64 | 1.0153 | -0.2194 | |||
| BKR / Baker Hughes Company | 0.21 | -69.04 | 8.15 | -72.99 | 1.0135 | -1.1473 | |||
| COP / ConocoPhillips | 0.09 | -49.40 | 7.78 | -56.77 | 0.9682 | -0.3214 | |||
| SG / Sweetgreen, Inc. | 0.46 | -37.43 | 6.88 | -62.79 | 0.8564 | -0.4691 | |||
| KO / The Coca-Cola Company | 0.09 | -50.92 | 6.59 | -51.52 | 0.8195 | -0.1540 | |||
| SNOW / Snowflake Inc. | 0.03 | -48.11 | 6.44 | -20.56 | 0.8015 | 0.2204 | |||
| LOW / Lowe's Companies, Inc. | 0.03 | -53.76 | 5.82 | -56.02 | 0.7240 | -0.2240 | |||
| VZ / Verizon Communications Inc. | 0.13 | -50.22 | 5.75 | -52.52 | 0.7147 | -0.1521 | |||
| FBT / First Trust Exchange-Traded Fund - First Trust NYSE Arca Biotechnology Index Fund | 0.02 | -52.45 | 4.00 | -54.91 | 0.4971 | -0.1378 | |||
| GLD / SPDR Gold Trust | 0.01 | -3.18 | 2.31 | 2.44 | 0.2874 | 0.1258 | |||
| XBI / SPDR Series Trust - SPDR S&P Biotech ETF | 0.02 | -52.15 | 2.01 | -51.08 | 0.2505 | -0.0443 | |||
| VIG / Vanguard Specialized Funds - Vanguard Dividend Appreciation ETF | 0.01 | -45.07 | 1.97 | -42.08 | 0.2457 | 0.0015 | |||
| QQQ / Invesco QQQ Trust, Series 1 | 0.00 | -44.68 | 1.92 | -34.94 | 0.2384 | 0.0274 | |||
| ROBO / Exchange Traded Concepts Trust - ROBO Global Robotics and Automation Index ETF | 0.02 | -51.14 | 1.42 | -43.29 | 0.1767 | -0.0027 | |||
| U / Unity Software Inc. | 0.05 | 6.86 | 1.30 | 32.01 | 0.1611 | 0.0908 | |||
| IJR / iShares Trust - iShares Core S&P Small-Cap ETF | 0.01 | -47.55 | 0.94 | -45.20 | 0.1165 | -0.0059 | |||
| AVGO / Broadcom Inc. | 0.00 | -49.38 | 0.81 | -16.70 | 0.1012 | 0.0313 | |||
| NOC / Northrop Grumman Corporation | 0.00 | -49.97 | 0.74 | -51.19 | 0.0920 | -0.0165 | |||
| VTV / Vanguard Index Funds - Vanguard Value ETF | 0.00 | -51.28 | 0.70 | -50.18 | 0.0876 | -0.0136 | |||
| IUSG / iShares Trust - iShares Core S&P U.S. Growth ETF | 0.00 | -47.96 | 0.67 | -38.50 | 0.0836 | 0.0054 | |||
| VXF / Vanguard Index Funds - Vanguard Extended Market ETF | 0.00 | -49.72 | 0.66 | -43.76 | 0.0824 | -0.0020 | |||
| IWM / iShares Trust - iShares Russell 2000 ETF | 0.00 | -54.66 | 0.66 | -50.96 | 0.0822 | -0.0143 | |||
| CELH / Celsius Holdings, Inc. | 0.01 | -53.81 | 0.62 | -39.84 | 0.0770 | 0.0033 | |||
| JNJ / Johnson & Johnson | 0.00 | -49.90 | 0.60 | -53.86 | 0.0744 | -0.0185 | |||
| IWF / iShares Trust - iShares Russell 1000 Growth ETF | 0.00 | -50.61 | 0.58 | -41.97 | 0.0725 | 0.0006 | |||
| XLF / The Select Sector SPDR Trust - The Financial Select Sector SPDR Fund | 0.01 | -50.62 | 0.58 | -48.12 | 0.0722 | -0.0079 | |||
| TSLA / Tesla, Inc. | 0.00 | -48.13 | 0.57 | -36.47 | 0.0714 | 0.0067 | |||
| SPY / SPDR S&P 500 ETF | 0.00 | -50.05 | 0.56 | -44.81 | 0.0702 | -0.0031 | |||
| XLI / The Select Sector SPDR Trust - The Industrial Select Sector SPDR Fund | 0.00 | -45.64 | 0.56 | -38.86 | 0.0698 | 0.0041 | |||
| SOFI / SoFi Technologies, Inc. | 0.03 | 0.54 | 0.0667 | 0.0667 | |||||
| XLV / The Select Sector SPDR Trust - The Health Care Select Sector SPDR Fund | 0.00 | -50.08 | 0.53 | -53.94 | 0.0662 | -0.0165 | |||
| XLE / The Select Sector SPDR Trust - The Energy Select Sector SPDR Fund | 0.01 | -51.72 | 0.46 | -56.24 | 0.0572 | -0.0180 | |||
| BROS / Dutch Bros Inc. | 0.01 | -51.45 | 0.46 | -46.24 | 0.0569 | -0.0041 | |||
| KOMP / SPDR Series Trust - SPDR S&P Kensho New Economies Composite ETF | 0.01 | -55.76 | 0.44 | -48.31 | 0.0553 | -0.0062 | |||
| OIH / VanEck ETF Trust - VanEck Oil Services ETF | 0.00 | -61.97 | 0.44 | -66.62 | 0.0545 | -0.0395 | |||
| META / Meta Platforms, Inc. | 0.00 | -16.86 | 0.43 | 6.45 | 0.0535 | 0.0245 | |||
| FLS / Flowserve Corporation | 0.01 | -47.40 | 0.42 | -43.60 | 0.0526 | -0.0011 | |||
| XOM / Exxon Mobil Corporation | 0.00 | -49.70 | 0.38 | -54.48 | 0.0475 | -0.0125 | |||
| DIS / The Walt Disney Company | 0.00 | -98.78 | 0.33 | -98.47 | 0.0416 | -1.5225 | |||
| VOX / Vanguard World Fund - Vanguard Communication Services ETF | 0.00 | -50.22 | 0.27 | -42.68 | 0.0342 | -0.0001 | |||
| T / AT&T Inc. | 0.01 | -43.31 | 0.27 | -42.03 | 0.0335 | 0.0002 | |||
| HACK / Amplify ETF Trust - Amplify Cybersecurity ETF | 0.00 | -50.11 | 0.27 | -39.91 | 0.0330 | 0.0013 | |||
| V / Visa Inc. | 0.00 | -49.29 | 0.23 | -48.54 | 0.0285 | -0.0034 | |||
| WMB / The Williams Companies, Inc. | 0.00 | -47.64 | 0.21 | -45.00 | 0.0260 | -0.0012 | |||
| BRK.B / Berkshire Hathaway Inc. | 0.00 | -49.88 | 0.21 | -54.44 | 0.0256 | -0.0067 | |||
| OXLC / Oxford Lane Capital Corp. | 0.00 | -100.00 | 0.00 | 0.0000 | |||||
| QQQI / NEOS ETF Trust - NEOS Nasdaq-100 High Income ETF | 0.00 | -100.00 | 0.00 | 0.0000 | |||||
| CLM / Cornerstone Strategic Investment Fund, Inc. | 0.00 | -100.00 | 0.00 | 0.0000 | |||||
| MSTR / Strategy Inc | 0.00 | -100.00 | 0.00 | 0.0000 | |||||
| GOOGL / Alphabet Inc. | 0.00 | -100.00 | 0.00 | 0.0000 | |||||
| EOG / EOG Resources, Inc. | 0.00 | -100.00 | 0.00 | 0.0000 | |||||
| ADBE / Adobe Inc. | 0.00 | -100.00 | 0.00 | 0.0000 | |||||
| QS / QuantumScape Corporation | 0.00 | -100.00 | 0.00 | 0.0000 | |||||
| KMI / Kinder Morgan, Inc. | 0.00 | -100.00 | 0.00 | 0.0000 | |||||
| VIS / Vanguard World Fund - Vanguard Industrials ETF | 0.00 | -100.00 | 0.00 | 0.0000 | |||||
| UAL / United Airlines Holdings, Inc. | 0.00 | -100.00 | 0.00 | 0.0000 | |||||
| TXN / Texas Instruments Incorporated | 0.00 | -100.00 | 0.00 | 0.0000 | |||||
| MPW / Medical Properties Trust, Inc. | 0.00 | -100.00 | 0.00 | 0.0000 | |||||
| CWEN / Clearway Energy, Inc. | 0.00 | -100.00 | 0.00 | 0.0000 | |||||
| SBRA / Sabra Health Care REIT, Inc. | 0.00 | -100.00 | 0.00 | 0.0000 | |||||
| IBB / iShares Trust - iShares Biotechnology ETF | 0.00 | -100.00 | 0.00 | 0.0000 |