Basic Stats
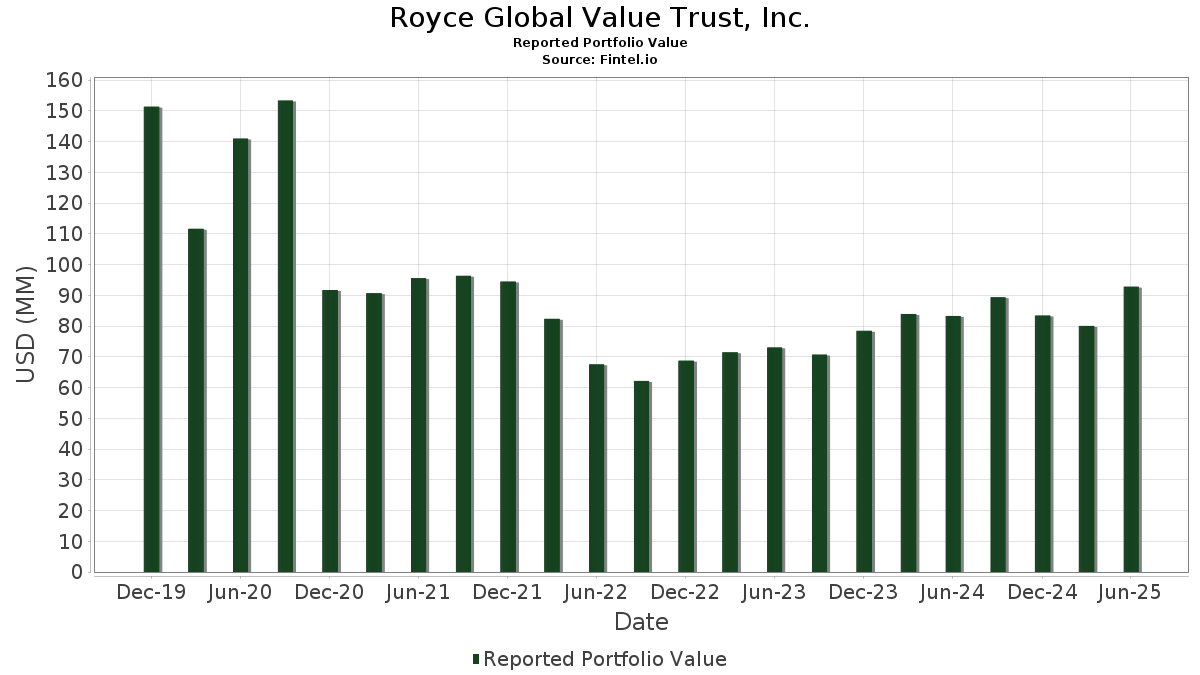
| Portfolio Value | $ 92,792,751 |
| Current Positions | 113 |
Latest Holdings, Performance, AUM (from 13F, 13D)
Royce Global Value Trust, Inc. has disclosed 113 total holdings in their latest SEC filings. Most recent portfolio value is calculated to be $ 92,792,751 USD. Actual Assets Under Management (AUM) is this value plus cash (which is not disclosed). Royce Global Value Trust, Inc.’s top holdings are The Tel-Aviv Stock Exchange Ltd. (IL:TASE) , Sprott Inc. (US:SII) , Protector Forsikring ASA (DE:PR4) , Alamos Gold Inc. (US:AGI) , and SEI Investments Company (US:SEIC) . Royce Global Value Trust, Inc.’s new positions include UFP Industries, Inc. (US:UFPI) , Riken Keiki Co., Ltd. (JP:7734) , Panamax New Energy AG (DE:ICP) , Auto Trader Group plc (GB:AUTO) , and .
Top Increases This Quarter
We use the change in the portfolio allocation because this is the most meaningful metric. Changes can be due to trades or changes in share prices.
| Security | Shares (MM) |
Value (MM$) |
Portfolio % | ΔPortfolio % |
|---|---|---|---|---|
| 4.61 | 4.9695 | 4.9695 | ||
| 0.19 | 3.65 | 3.9382 | 1.0063 | |
| 0.01 | 1.07 | 1.1563 | 0.9061 | |
| 0.05 | 3.15 | 3.4009 | 0.8505 | |
| 0.00 | 0.94 | 1.0144 | 0.4786 | |
| 0.01 | 0.70 | 0.7570 | 0.4664 | |
| 0.05 | 1.40 | 1.5128 | 0.3874 | |
| 0.01 | 1.57 | 1.6912 | 0.3805 | |
| 0.02 | 1.29 | 1.3922 | 0.3568 | |
| 0.04 | 1.09 | 1.1756 | 0.2909 |
Top Decreases This Quarter
We use the change in the portfolio allocation because this is the most meaningful metric. Changes can be due to trades or changes in share prices.
| Security | Shares (MM) |
Value (MM$) |
Portfolio % | ΔPortfolio % |
|---|---|---|---|---|
| 0.02 | 0.61 | 0.6606 | -0.7841 | |
| 0.01 | 0.43 | 0.4612 | -0.5828 | |
| 0.09 | 2.50 | 2.6984 | -0.4380 | |
| 0.02 | 0.73 | 0.7912 | -0.4336 | |
| 0.10 | 1.18 | 1.2673 | -0.4109 | |
| 0.01 | 1.25 | 1.3434 | -0.4081 | |
| 0.01 | 0.83 | 0.8901 | -0.3827 | |
| 0.03 | 1.17 | 1.2665 | -0.3528 | |
| 0.04 | 1.24 | 1.3315 | -0.3505 | |
| 0.16 | 0.50 | 0.5348 | -0.3279 |
13F and Fund Filings
This form was filed on 2025-08-15 for the reporting period 2025-06-30. Click the link icon to see the full transaction history.
Upgrade to unlock premium data and export to Excel ![]() .
.
| Security | Type | Avg Share Price | Shares (MM) |
ΔShares (%) |
ΔShares (%) |
Value ($MM) |
Portfolio (%) |
ΔPortfolio (%) |
|
|---|---|---|---|---|---|---|---|---|---|
| FIXED INC CLEARING CORP.REPO / RA (000000000) | 4.61 | 4.9695 | 4.9695 | ||||||
| TASE / The Tel-Aviv Stock Exchange Ltd. | 0.19 | -5.17 | 3.65 | 55.40 | 3.9382 | 1.0063 | |||
| SII / Sprott Inc. | 0.05 | 0.00 | 3.15 | 54.31 | 3.4009 | 0.8505 | |||
| PR4 / Protector Forsikring ASA | 0.06 | -7.86 | 2.75 | 21.41 | 2.9597 | 0.1384 | |||
| AGI / Alamos Gold Inc. | 0.09 | 0.00 | 2.50 | -0.48 | 2.6984 | -0.4380 | |||
| SEIC / SEI Investments Company | 0.03 | 0.00 | 2.48 | 15.75 | 2.6787 | 0.0011 | |||
| APG / APi Group Corporation | 0.04 | -7.77 | 2.17 | 31.67 | 2.3354 | 0.2830 | |||
| X / TMX Group Limited | 0.05 | 0.00 | 2.02 | 16.12 | 2.1752 | 0.0073 | |||
| 0JX / Stadio Holdings Limited | 3.69 | 0.00 | 1.82 | 19.95 | 1.9646 | 0.0691 | |||
| KAR / Karnov Group AB (publ) | 0.15 | 0.00 | 1.65 | 30.33 | 1.7793 | 0.1998 | |||
| SE0017766843 / OEM International AB | 0.11 | 0.00 | 1.58 | 7.80 | 1.6997 | -0.1253 | |||
| NVMI / Nova Ltd. | 0.01 | 0.00 | 1.57 | 49.33 | 1.6912 | 0.3805 | |||
| ESAB / ESAB Corporation | 0.01 | 0.00 | 1.56 | 3.51 | 1.6844 | -0.1991 | |||
| ONEXF / Onex Corporation | 0.02 | 0.00 | 1.47 | 22.99 | 1.5809 | 0.0938 | |||
| MORN / Morningstar, Inc. | 0.00 | 0.00 | 1.44 | 4.74 | 1.5484 | -0.1630 | |||
| PHOE1 / Phoenix Holdings Ltd/The | 0.05 | 0.00 | 1.40 | 55.54 | 1.5128 | 0.3874 | |||
| STLJF / Stella-Jones Inc. | 0.02 | 27.99 | 1.29 | 55.54 | 1.3922 | 0.3568 | |||
| EVI / EVI Industries, Inc. | 0.06 | 0.00 | 1.28 | 30.14 | 1.3783 | 0.1524 | |||
| MJDLF / Major Drilling Group International Inc. | 0.19 | 0.00 | 1.26 | 16.82 | 1.3629 | 0.0121 | |||
| IOSP / Innospec Inc. | 0.01 | 0.00 | 1.25 | -11.25 | 1.3434 | -0.4081 | |||
| IMAX / IMAX Corporation | 0.04 | -13.68 | 1.24 | -8.38 | 1.3315 | -0.3505 | |||
| GCMG / GCM Grosvenor Inc. | 0.10 | 0.00 | 1.18 | -12.64 | 1.2673 | -0.4109 | |||
| APAM / Artisan Partners Asset Management Inc. | 0.03 | -20.18 | 1.17 | -9.55 | 1.2665 | -0.3528 | |||
| KWR / Quaker Chemical Corporation | 0.01 | 38.36 | 1.17 | 25.27 | 1.2624 | 0.0966 | |||
| RGLD / Royal Gold, Inc. | 0.01 | 0.00 | 1.12 | 8.71 | 1.2118 | -0.0774 | |||
| H11 / Halma plc | 0.03 | 4.33 | 1.12 | 37.04 | 1.2096 | 0.1882 | |||
| ACA / Arcosa, Inc. | 0.01 | 0.00 | 1.10 | 12.40 | 1.1835 | -0.0344 | |||
| AIAENG / AIA Engineering Limited | 0.03 | 0.00 | 1.10 | -1.08 | 1.1834 | -0.2006 | |||
| TNE / Technology One Limited | 0.04 | 0.00 | 1.09 | 53.74 | 1.1756 | 0.2909 | |||
| RBA / RB Global, Inc. | 0.01 | 405.00 | 1.07 | 436.00 | 1.1563 | 0.9061 | |||
| SAR / Gr. Sarantis S.A. | 0.06 | 0.00 | 1.00 | 11.96 | 1.0813 | -0.0359 | |||
| LFUS / Littelfuse, Inc. | 0.00 | 3.75 | 0.94 | 22.88 | 1.0144 | 0.4786 | |||
| JSCIF / Judges Scientific plc | 0.01 | 0.00 | 0.93 | 18.57 | 0.9987 | 0.0243 | |||
| CIGI / Colliers International Group Inc. | 0.01 | 40.44 | 0.91 | 51.25 | 0.9774 | 0.2292 | |||
| AIF / Altus Group Limited | 0.02 | 0.00 | 0.87 | 8.22 | 0.9374 | -0.0648 | |||
| DSGX / The Descartes Systems Group Inc. | 0.01 | 0.00 | 0.86 | 0.82 | 0.9232 | -0.1364 | |||
| KARN / Kardex Holding AG | 0.00 | 0.00 | 0.83 | 30.93 | 0.9001 | 0.1050 | |||
| TRNS / Transcat, Inc. | 0.01 | -29.92 | 0.83 | -19.12 | 0.8901 | -0.3827 | |||
| ESI / Element Solutions Inc | 0.04 | 0.00 | 0.82 | 0.12 | 0.8889 | -0.1378 | |||
| NTB / The Bank of N.T. Butterfield & Son Limited | 0.02 | -11.90 | 0.82 | 0.24 | 0.8832 | -0.1364 | |||
| GFF / Griffon Corporation | 0.01 | 0.00 | 0.81 | 1.24 | 0.8778 | -0.1257 | |||
| KEYS / Keystone Law Group plc | 0.10 | 0.00 | 0.80 | 25.20 | 0.8632 | 0.0652 | |||
| COH / Cochlear Limited | 0.00 | 0.00 | 0.79 | 20.06 | 0.8527 | 0.0310 | |||
| KBR / KBR, Inc. | 0.02 | 0.00 | 0.79 | -3.79 | 0.8485 | -0.1716 | |||
| SE0012308088 / Teqnion AB | 0.05 | 0.00 | 0.76 | -5.22 | 0.8225 | -0.1816 | |||
| TOTS3 / TOTVS S.A. | 0.10 | 0.00 | 0.76 | 32.87 | 0.8199 | 0.1058 | |||
| 9746 / TKC Corporation | 0.03 | 0.00 | 0.75 | 13.87 | 0.8056 | -0.0132 | |||
| CCORF / Canaccord Genuity Group Inc. | 0.10 | 0.00 | 0.74 | 30.34 | 0.7968 | 0.0886 | |||
| IMCD / IMCD N.V. | 0.01 | 0.00 | 0.74 | 0.82 | 0.7966 | -0.1166 | |||
| ACQ / AutoCanada Inc. | 0.05 | 0.00 | 0.74 | 42.00 | 0.7955 | 0.1474 | |||
| VNT / Vontier Corporation | 0.02 | -33.46 | 0.73 | -25.28 | 0.7912 | -0.4336 | |||
| MKSI / MKS Inc. | 0.01 | 143.10 | 0.70 | 202.59 | 0.7570 | 0.4664 | |||
| INE118H01025 / BSE Ltd | 0.02 | 200.00 | 0.70 | 53.39 | 0.7566 | 0.1856 | |||
| BRAV / Bravida Holding AB (publ) | 0.07 | 0.00 | 0.69 | 10.90 | 0.7471 | -0.0314 | |||
| PSGK.N0000 / PSG Financial Services Limited | 0.55 | 0.00 | 0.69 | 26.70 | 0.7425 | 0.0649 | |||
| TDY / Teledyne Technologies Incorporated | 0.00 | 0.00 | 0.69 | 3.00 | 0.7401 | -0.0918 | |||
| GB00BD8SLV43 / Marlowe PLC | 0.11 | 0.00 | 0.68 | 44.92 | 0.7382 | 0.1485 | |||
| VCTR / Victory Capital Holdings, Inc. | 0.01 | 16.72 | 0.67 | 28.32 | 0.7187 | 0.0712 | |||
| CRL / Creightons Plc | 0.03 | 0.00 | 0.67 | 45.83 | 0.7175 | 0.1479 | |||
| PSYTF / Pason Systems Inc. | 0.07 | 0.00 | 0.64 | -1.38 | 0.6932 | -0.1196 | |||
| 9A5 / discoverIE Group plc | 0.07 | 0.00 | 0.64 | 27.40 | 0.6870 | 0.0631 | |||
| VZN / VZ Holding AG | 0.00 | 0.00 | 0.63 | 14.65 | 0.6841 | -0.0070 | |||
| VNOM / Viper Energy, Inc. | 0.02 | -37.35 | 0.61 | -47.15 | 0.6606 | -0.7841 | |||
| CBZ / CBIZ, Inc. | 0.01 | 0.00 | 0.60 | -5.53 | 0.6458 | -0.1447 | |||
| ENOV / Enovis Corporation | 0.02 | 0.00 | 0.58 | -17.90 | 0.6232 | -0.2554 | |||
| ATMU / Atmus Filtration Technologies Inc. | 0.02 | 0.00 | 0.57 | -0.87 | 0.6153 | -0.1027 | |||
| CMDXF / Computer Modelling Group Ltd. | 0.10 | -4.55 | 0.56 | -9.76 | 0.5988 | -0.1691 | |||
| BLX / Banco Latinoamericano de Comercio Exterior, S. A. | 0.01 | 0.00 | 0.55 | 9.96 | 0.5959 | -0.0303 | |||
| DP9 / Diploma PLC | 0.01 | 0.00 | 0.55 | 34.47 | 0.5932 | 0.0822 | |||
| LNN / Lindsay Corporation | 0.00 | 0.00 | 0.51 | 14.06 | 0.5516 | -0.0082 | |||
| NPO / Enpro Inc. | 0.00 | 48.87 | 0.50 | 76.22 | 0.5442 | 0.1869 | |||
| IPH / IPH Limited | 0.16 | -32.15 | 0.50 | -28.22 | 0.5348 | -0.3279 | |||
| S8T / SThree plc | 0.15 | 0.00 | 0.49 | -1.60 | 0.5304 | -0.0942 | |||
| CLBT / Cellebrite DI Ltd. | 0.03 | 0.00 | 0.48 | -17.59 | 0.5157 | -0.2089 | |||
| OWL / Blue Owl Capital Inc. | 0.02 | 0.00 | 0.48 | -4.22 | 0.5152 | -0.1067 | |||
| MABHF / Mortgage Advice Bureau (Holdings) plc | 0.04 | 0.00 | 0.44 | 24.22 | 0.4701 | 0.0317 | |||
| ALD / Ayvens | 0.04 | 0.00 | 0.43 | 26.53 | 0.4680 | 0.0396 | |||
| AL / Air Lease Corporation | 0.01 | -57.78 | 0.43 | -48.92 | 0.4612 | -0.5828 | |||
| PQX1 / Biotage AB (publ) | 0.03 | -28.76 | 0.41 | 13.02 | 0.4403 | -0.0109 | |||
| HGTY / Hagerty, Inc. | 0.04 | 0.00 | 0.40 | 11.83 | 0.4284 | -0.0148 | |||
| FORM / FormFactor, Inc. | 0.01 | 0.00 | 0.39 | 21.88 | 0.4206 | 0.0205 | |||
| FPH / Fisher & Paykel Healthcare Corporation Limited | 0.02 | 0.00 | 0.37 | 15.12 | 0.4027 | -0.0021 | |||
| ODPV3 / Odontoprev S.A. | 0.17 | 0.00 | 0.37 | 18.21 | 0.3991 | 0.0075 | |||
| PAAS / Pan American Silver Corp. | 0.01 | 0.00 | 0.36 | 9.76 | 0.3889 | -0.0204 | |||
| Optima Health PLC / EC (GB00BRSCY602) | 0.11 | 0.00 | 0.32 | 28.63 | 0.3449 | 0.0345 | |||
| KAI / Kadant Inc. | 0.00 | 0.00 | 0.31 | -5.83 | 0.3313 | -0.0755 | |||
| 9759 / NSD Co., Ltd. | 0.01 | 0.00 | 0.30 | 10.62 | 0.3261 | -0.0147 | |||
| 0P5 / Genuit Group plc | 0.05 | 0.00 | 0.29 | 15.75 | 0.3180 | 0.0006 | |||
| RST / Restore plc | 0.08 | 0.00 | 0.29 | 22.18 | 0.3155 | 0.0162 | |||
| OSSR / Ossur HF | 0.05 | 0.00 | 0.27 | 29.95 | 0.2908 | 0.0315 | |||
| TU / TELUS Corporation | 0.02 | 0.00 | 0.26 | 12.02 | 0.2824 | -0.0094 | |||
| NEWT / NewtekOne, Inc. | 0.02 | 0.00 | 0.26 | -5.56 | 0.2755 | -0.0625 | |||
| LASR / nLIGHT, Inc. | 0.01 | 0.00 | 0.25 | 153.54 | 0.2716 | 0.1475 | |||
| AFX / Carl Zeiss Meditec AG | 0.00 | 0.00 | 0.23 | 2.24 | 0.2461 | -0.0321 | |||
| FKCIF / Fukui Computer Holdings,Inc. | 0.01 | 0.00 | 0.22 | -8.98 | 0.2411 | -0.0654 | |||
| UFPI / UFP Industries, Inc. | 0.00 | 0.22 | 0.2357 | 0.2357 | |||||
| 30T / TechnoPro Holdings, Inc. | 0.01 | 0.00 | 0.21 | 32.08 | 0.2268 | 0.0273 | |||
| IUSDF / AS ONE Corporation | 0.01 | 0.00 | 0.19 | 11.56 | 0.2089 | -0.0076 | |||
| 532839 / Dish TV India Limited | 3.02 | 0.00 | 0.18 | -10.66 | 0.1908 | -0.0561 | |||
| GLBE / Global-E Online Ltd. | 0.01 | 0.00 | 0.17 | -5.95 | 0.1880 | -0.0432 | |||
| RGEN / Repligen Corporation | 0.00 | 0.00 | 0.16 | -2.45 | 0.1724 | -0.0317 | |||
| ZAE400000036 / CA Sales Holdings Ltd | 0.15 | 0.00 | 0.14 | 4.41 | 0.1542 | -0.0162 | |||
| FDP / Fresh Del Monte Produce Inc. | 0.05 | 0.00 | 0.14 | -9.27 | 0.1479 | -0.0413 | |||
| 24P / Curro Holdings Limited | 0.26 | 0.00 | 0.13 | 11.02 | 0.1419 | -0.0058 | |||
| CDON / CDON AB | 0.03 | 0.00 | 0.13 | 23.58 | 0.1419 | 0.0090 | |||
| MYCR / Mycronic AB (publ) | 0.00 | 0.10 | 0.1069 | 0.1069 | |||||
| 7734 / Riken Keiki Co., Ltd. | 0.00 | 0.10 | 0.1042 | 0.1042 | |||||
| ACVA / ACV Auctions Inc. | 0.01 | 0.00 | 0.10 | 14.46 | 0.1032 | -0.0005 | |||
| ICP / Panamax New Energy AG | 0.00 | 0.09 | 0.0942 | 0.0942 | |||||
| AUTO / Auto Trader Group plc | 0.01 | 0.08 | 0.0854 | 0.0854 | |||||
| AVDL / Avadel Pharmaceuticals plc | 0.01 | -78.96 | 0.07 | -76.17 | 0.0712 | -0.2752 | |||
| RELL / Richardson Electronics, Ltd. | 0.01 | -44.03 | 0.06 | -51.59 | 0.0661 | -0.0920 | |||
| ACES / PT Aspirasi Hidup Indonesia Tbk | 2.00 | -50.00 | 0.06 | -49.17 | 0.0659 | -0.0847 | |||
| MIDAS / Midas Holdings Ltd | 0.40 | 0.00 | 0.00 | 0.0000 | 0.0000 |