Basic Stats
| Insider Profile | RMF GP, LLC |
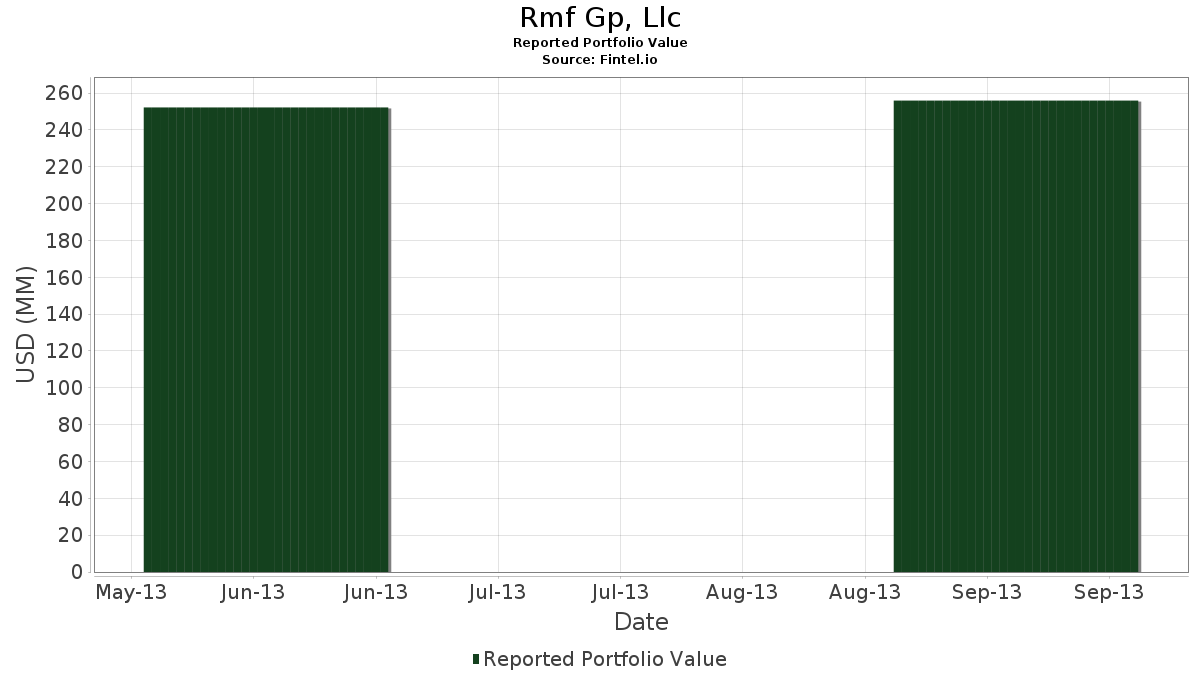
| Portfolio Value | $ 255,913,000 |
| Current Positions | 27 |
Latest Holdings, Performance, AUM (from 13F, 13D)
Rmf Gp, Llc has disclosed 27 total holdings in their latest SEC filings. Most recent portfolio value is calculated to be $ 255,913,000 USD. Actual Assets Under Management (AUM) is this value plus cash (which is not disclosed). Rmf Gp, Llc’s top holdings are Ensco plc (US:ESV) , BP p.l.c. - Depositary Receipt (Common Stock) (US:BP) , Statoil ASA (US:STO) , Bank of America Corporation (US:BAC) , and Capital Bank Financial Corp. (US:CBF) . Rmf Gp, Llc’s new positions include SPDR S&P 500 ETF (US:SPY) , iShares Trust - iShares MSCI EAFE ETF (US:EFA) , iShares, Inc. - iShares MSCI Emerging Markets ETF (US:EEM) , SPDR S&P MidCap 400 ETF Trust (US:MDY) , and iShares Trust - iShares Russell 2000 ETF (US:IWM) .
Top Increases This Quarter
We use the change in the portfolio allocation because this is the most meaningful metric. Changes can be due to trades or changes in share prices.
| Security | Shares (MM) |
Value (MM$) |
Portfolio % | ΔPortfolio % |
|---|---|---|---|---|
| 1.19 | 63.96 | 24.9940 | 24.9940 | |
| 0.73 | 30.54 | 11.9345 | 11.9345 | |
| 1.80 | 24.79 | 9.6884 | 9.6884 | |
| 0.51 | 15.87 | 6.2021 | 6.2021 | |
| 1.23 | 14.76 | 5.7684 | 5.7684 | |
| 0.75 | 16.46 | 6.4330 | 5.3017 | |
| 0.41 | 12.63 | 4.9345 | 4.9345 | |
| 0.20 | 8.63 | 3.3711 | 3.3711 | |
| 0.13 | 5.93 | 2.3176 | 2.3176 | |
| 0.20 | 4.88 | 1.9081 | 1.9081 |
Top Decreases This Quarter
We use the change in the portfolio allocation because this is the most meaningful metric. Changes can be due to trades or changes in share prices.
| Security | Shares (MM) |
Value (MM$) |
Portfolio % | ΔPortfolio % |
|---|
13F and Fund Filings
This form was filed on 2013-11-13 for the reporting period 2013-09-30. Click the link icon to see the full transaction history.
Upgrade to unlock premium data and export to Excel ![]() .
.
| Security | Type | Avg Share Price | Shares (MM) |
ΔShares (%) |
ΔShares (%) |
Value ($MM) |
Portfolio (%) |
ΔPortfolio (%) |
|
|---|---|---|---|---|---|---|---|---|---|
| ESV / Ensco plc | 1.19 | 0.00 | 63.96 | -7.52 | 24.9940 | 24.9940 | |||
| BP / BP p.l.c. - Depositary Receipt (Common Stock) | 0.73 | 0.00 | 30.54 | 0.70 | 11.9345 | 11.9345 | |||
| STO / Statoil ASA | 1.10 | 0.00 | 24.86 | 9.62 | 9.7131 | 0.7213 | |||
| BAC / Bank of America Corporation | 1.80 | -5.22 | 24.79 | 1.71 | 9.6884 | 9.6884 | |||
| CBF / Capital Bank Financial Corp. | 0.75 | 400.00 | 16.46 | 477.04 | 6.4330 | 5.3017 | |||
| / XL Group Ltd. | 0.51 | 0.00 | 15.87 | 1.65 | 6.2021 | 6.2021 | |||
| STAR / iStar Inc | 1.23 | -0.70 | 14.76 | 5.89 | 5.7684 | 5.7684 | |||
| HIG / The Hartford Insurance Group, Inc. | 0.41 | -33.01 | 12.63 | -32.58 | 4.9345 | 4.9345 | |||
| TK / Teekay Corporation Ltd. | 0.20 | 0.00 | 8.63 | 5.22 | 3.3711 | 3.3711 | |||
| NGP CAP RES CO / (62912R107) | 0.86 | 6.43 | 0.0000 | ||||||
| LPNT / LifePoint Health, Inc. | 0.13 | 0.00 | 5.93 | -4.52 | 2.3176 | 2.3176 | |||
| GE / General Electric Company | 0.20 | -32.85 | 4.88 | -30.83 | 1.9081 | 1.9081 | |||
| KFH / KKR Financial Holdings LLC | 0.42 | 0.00 | 4.34 | -2.08 | 1.6947 | 1.6947 | |||
| EFC / Ellington Financial Inc. | 0.18 | 0.00 | 4.12 | -1.48 | 1.6087 | 1.6087 | |||
| CSCO / Cisco Systems, Inc. | 0.17 | 0.00 | 3.94 | -3.72 | 1.5392 | 1.5392 | |||
| HPQ / HP Inc. | 0.15 | 0.00 | 3.15 | -15.35 | 1.2305 | 1.2305 | |||
| GM / General Motors Company | 0.07 | -64.98 | 2.42 | -62.18 | 0.9468 | 0.9468 | |||
| GM.WS.A / General Motors Company | 0.08 | 0.00 | 2.21 | 10.11 | 0.8640 | 0.8640 | |||
| DHT / DHT Holdings, Inc. | 0.49 | 45.33 | 2.16 | 41.69 | 0.8433 | 0.8433 | |||
| GM.WS.B / General Motors Company - Warrants 07/10/2019 | 0.08 | 0.00 | 1.56 | 13.82 | 0.6084 | 0.6084 | |||
| SPY / SPDR S&P 500 ETF | 0.00 | 0.69 | 0.2700 | 0.2700 | |||||
| EFA / iShares Trust - iShares MSCI EAFE ETF | 0.01 | 0.55 | 0.2161 | 0.2161 | |||||
| EEM / iShares, Inc. - iShares MSCI Emerging Markets ETF | 0.01 | 0.41 | 0.1586 | 0.1586 | |||||
| MDY / SPDR S&P MidCap 400 ETF Trust | 0.00 | 0.30 | 0.1184 | 0.1184 | |||||
| IWM / iShares Trust - iShares Russell 2000 ETF | 0.00 | 0.30 | 0.1180 | 0.1180 | |||||
| HSY / The Hershey Company | 0.00 | 0.02 | 0.0063 | 0.0063 | |||||
| UNITEK GLOBAL SVCS INC / COM PAR $.00002 (91324T302) | 0.00 | 0.00 | 0.0000 |