Basic Stats
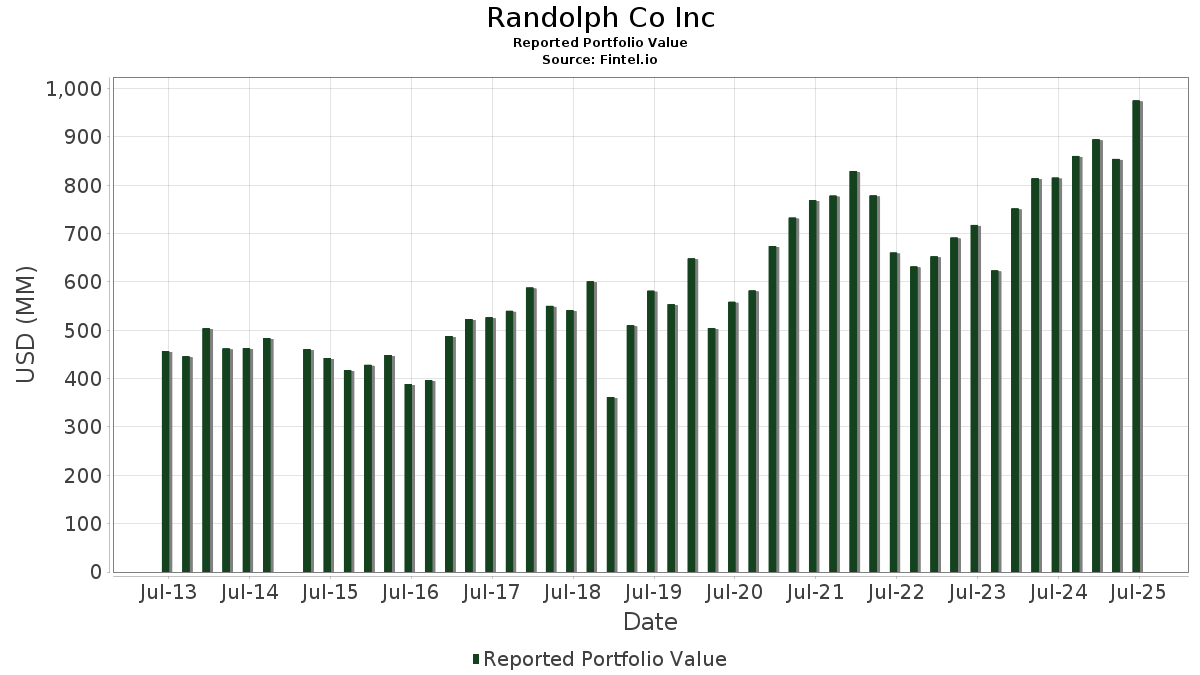
| Portfolio Value | $ 975,246,694 |
| Current Positions | 46 |
Latest Holdings, Performance, AUM (from 13F, 13D)
Randolph Co Inc has disclosed 46 total holdings in their latest SEC filings. Most recent portfolio value is calculated to be $ 975,246,694 USD. Actual Assets Under Management (AUM) is this value plus cash (which is not disclosed). Randolph Co Inc’s top holdings are Broadcom Inc. (US:AVGO) , Cintas Corporation (US:CTAS) , JPMorgan Chase & Co. (US:JPM) , Blackstone Inc. (US:BX) , and Microsoft Corporation (US:MSFT) . Randolph Co Inc’s new positions include iShares Trust - iShares 7-10 Year Treasury Bond ETF (US:IEF) , Alexandria Real Estate Equities, Inc. (US:ARE) , Edwards Lifesciences Corporation (US:EW) , Vanguard Index Funds - Vanguard S&P 500 ETF (US:VOO) , and .
Top Increases This Quarter
We use the change in the portfolio allocation because this is the most meaningful metric. Changes can be due to trades or changes in share prices.
| Security | Shares (MM) |
Value (MM$) |
Portfolio % | ΔPortfolio % |
|---|---|---|---|---|
| 0.39 | 108.53 | 11.1284 | 3.4452 | |
| 0.82 | 27.62 | 2.8323 | 2.8323 | |
| 0.16 | 28.66 | 2.9384 | 2.4190 | |
| 0.25 | 23.56 | 2.4159 | 2.4159 | |
| 0.30 | 21.69 | 2.2241 | 2.2241 | |
| 0.27 | 59.39 | 6.0902 | 2.0788 | |
| 0.12 | 14.25 | 1.4609 | 1.2233 | |
| 0.14 | 14.64 | 1.5012 | 1.0449 | |
| 0.09 | 43.64 | 4.4750 | 0.7087 | |
| 0.05 | 36.57 | 3.7495 | 0.4373 |
Top Decreases This Quarter
We use the change in the portfolio allocation because this is the most meaningful metric. Changes can be due to trades or changes in share prices.
| Security | Shares (MM) |
Value (MM$) |
Portfolio % | ΔPortfolio % |
|---|---|---|---|---|
| 0.28 | 25.99 | 2.6647 | -4.4386 | |
| 0.00 | 0.33 | 0.0335 | -2.1224 | |
| 0.22 | 24.12 | 2.4732 | -0.5980 | |
| 0.29 | 25.62 | 2.6274 | -0.4325 | |
| 0.04 | 39.27 | 4.0265 | -0.3325 | |
| 0.07 | 23.59 | 2.4187 | -0.2599 | |
| 0.33 | 48.70 | 4.9939 | -0.2380 | |
| 0.12 | 36.03 | 3.6942 | -0.2201 | |
| 0.67 | 19.69 | 2.0191 | -0.1922 | |
| 0.42 | 26.35 | 2.7022 | -0.1884 |
13F and Fund Filings
This form was filed on 2025-07-16 for the reporting period 2025-06-30. Click the link icon to see the full transaction history.
Upgrade to unlock premium data and export to Excel ![]() .
.
| Security | Type | Avg Share Price | Shares (MM) |
ΔShares (%) |
ΔShares (%) |
Value ($MM) |
Portfolio (%) |
ΔPortfolio (%) |
|
|---|---|---|---|---|---|---|---|---|---|
| AVGO / Broadcom Inc. | 0.39 | 0.41 | 108.53 | 65.32 | 11.1284 | 3.4452 | |||
| CTAS / Cintas Corporation | 0.27 | 59.80 | 59.39 | 73.29 | 6.0902 | 2.0788 | |||
| JPM / JPMorgan Chase & Co. | 0.17 | 0.43 | 49.64 | 18.69 | 5.0902 | 0.1952 | |||
| BX / Blackstone Inc. | 0.33 | 1.81 | 48.70 | 8.95 | 4.9939 | -0.2380 | |||
| MSFT / Microsoft Corporation | 0.09 | 2.35 | 43.64 | 35.61 | 4.4750 | 0.7087 | |||
| GLW / Corning Incorporated | 0.77 | 0.50 | 40.75 | 15.45 | 4.1783 | 0.0476 | |||
| COST / Costco Wholesale Corporation | 0.04 | 0.73 | 39.27 | 5.43 | 4.0265 | -0.3325 | |||
| HON / Honeywell International Inc. | 0.16 | 1.31 | 36.82 | 11.42 | 3.7751 | -0.0920 | |||
| INTU / Intuit Inc. | 0.05 | 0.72 | 36.57 | 29.21 | 3.7495 | 0.4373 | |||
| GD / General Dynamics Corporation | 0.12 | 0.67 | 36.03 | 7.72 | 3.6942 | -0.2201 | |||
| CSCO / Cisco Systems, Inc. | 0.51 | 0.73 | 35.13 | 13.25 | 3.6021 | -0.0283 | |||
| HBAN / Huntington Bancshares Incorporated | 1.82 | 0.19 | 30.52 | 11.86 | 3.1295 | -0.0635 | |||
| VB / Vanguard Index Funds - Vanguard Small-Cap ETF | 0.12 | 1.05 | 28.69 | 7.99 | 2.9423 | -0.1675 | |||
| NEM / Newmont Corporation | 0.49 | 0.39 | 28.67 | 21.15 | 2.9398 | 0.1701 | |||
| GOOGL / Alphabet Inc. | 0.16 | 466.61 | 28.66 | 545.70 | 2.9384 | 2.4190 | |||
| SLB / Schlumberger Limited | 0.82 | 27.62 | 2.8323 | 2.8323 | |||||
| IJH / iShares Trust - iShares Core S&P Mid-Cap ETF | 0.42 | 0.38 | 26.35 | 6.70 | 2.7022 | -0.1884 | |||
| BIL / SPDR Series Trust - SPDR Bloomberg 1-3 Month T-Bill ETF | 0.28 | -57.18 | 25.99 | -57.19 | 2.6647 | -4.4386 | |||
| MDT / Medtronic plc | 0.29 | 1.03 | 25.62 | -2.00 | 2.6274 | -0.4325 | |||
| XOM / Exxon Mobil Corporation | 0.22 | 1.40 | 24.12 | -8.09 | 2.4732 | -0.5980 | |||
| V / Visa Inc. | 0.07 | 1.73 | 23.59 | 3.06 | 2.4187 | -0.2599 | |||
| IEF / iShares Trust - iShares 7-10 Year Treasury Bond ETF | 0.25 | 23.56 | 2.4159 | 2.4159 | |||||
| ARE / Alexandria Real Estate Equities, Inc. | 0.30 | 21.69 | 2.2241 | 2.2241 | |||||
| SCCO / Southern Copper Corporation | 0.20 | 1.19 | 20.01 | 9.53 | 2.0517 | -0.0862 | |||
| KMI / Kinder Morgan, Inc. | 0.67 | 1.13 | 19.69 | 4.21 | 2.0191 | -0.1922 | |||
| PANW / Palo Alto Networks, Inc. | 0.08 | 0.15 | 16.92 | 20.11 | 1.7350 | 0.0863 | |||
| AEP / American Electric Power Company, Inc. | 0.14 | 295.46 | 14.64 | 275.58 | 1.5012 | 1.0449 | |||
| DUK / Duke Energy Corporation | 0.12 | 625.31 | 14.25 | 601.82 | 1.4609 | 1.2233 | |||
| SMIN / iShares Trust - iShares MSCI India Small-Cap ETF | 0.14 | 1.48 | 10.73 | 15.03 | 1.1005 | 0.0085 | |||
| EPI / WisdomTree Trust - WisdomTree India Earnings Fund | 0.22 | 1.67 | 10.25 | 10.42 | 1.0509 | -0.0354 | |||
| INDA / iShares Trust - iShares MSCI India ETF | 0.17 | 1.69 | 9.61 | 9.98 | 0.9850 | -0.0372 | |||
| IVV / iShares Trust - iShares Core S&P 500 ETF | 0.00 | 36.17 | 2.03 | 50.48 | 0.2085 | 0.0504 | |||
| SPY / SPDR S&P 500 ETF | 0.00 | 0.03 | 1.95 | 10.49 | 0.1998 | -0.0066 | |||
| VO / Vanguard Index Funds - Vanguard Mid-Cap ETF | 0.00 | -21.21 | 0.98 | -14.72 | 0.1004 | -0.0340 | |||
| EG / Everest Group, Ltd. | 0.00 | -7.31 | 0.93 | -13.36 | 0.0959 | -0.0303 | |||
| PG / The Procter & Gamble Company | 0.01 | 16.84 | 0.89 | 9.31 | 0.0915 | -0.0041 | |||
| AAPL / Apple Inc. | 0.00 | 0.59 | 0.49 | -7.05 | 0.0500 | -0.0114 | |||
| TRV / The Travelers Companies, Inc. | 0.00 | 26.20 | 0.40 | 28.03 | 0.0412 | 0.0044 | |||
| MRK / Merck & Co., Inc. | 0.00 | -97.99 | 0.33 | -98.23 | 0.0335 | -2.1224 | |||
| EW / Edwards Lifesciences Corporation | 0.00 | 0.30 | 0.0309 | 0.0309 | |||||
| DGRO / iShares Trust - iShares Core Dividend Growth ETF | 0.00 | -57.87 | 0.27 | -56.46 | 0.0280 | -0.0454 | |||
| MOAT / VanEck ETF Trust - VanEck Morningstar Wide Moat ETF | 0.00 | -58.03 | 0.24 | -55.28 | 0.0243 | -0.0378 | |||
| NVDD / Direxion Shares ETF Trust - Direxion Daily NVDA Bear 1X Shares | 0.00 | 0.23 | 0.0232 | 0.0232 | |||||
| IWF / iShares Trust - iShares Russell 1000 Growth ETF | 0.00 | 0.21 | 0.0219 | 0.0219 | |||||
| VOO / Vanguard Index Funds - Vanguard S&P 500 ETF | 0.00 | 0.21 | 0.0214 | 0.0214 | |||||
| GNK / Genco Shipping & Trading Limited | 0.01 | 0.00 | 0.13 | -2.26 | 0.0134 | -0.0022 | |||
| MTLS / Materialise NV - Depositary Receipt (Common Stock) | 0.00 | -100.00 | 0.00 | 0.0000 | |||||
| PEP / PepsiCo, Inc. | 0.00 | -100.00 | 0.00 | 0.0000 | |||||
| ADBE / Adobe Inc. | 0.00 | -100.00 | 0.00 | 0.0000 | |||||
| LYB / LyondellBasell Industries N.V. | 0.00 | -100.00 | 0.00 | 0.0000 | |||||
| TAP / Molson Coors Beverage Company | 0.00 | -100.00 | 0.00 | 0.0000 | |||||
| QCOM / QUALCOMM Incorporated | 0.00 | -100.00 | 0.00 | 0.0000 |