Basic Stats
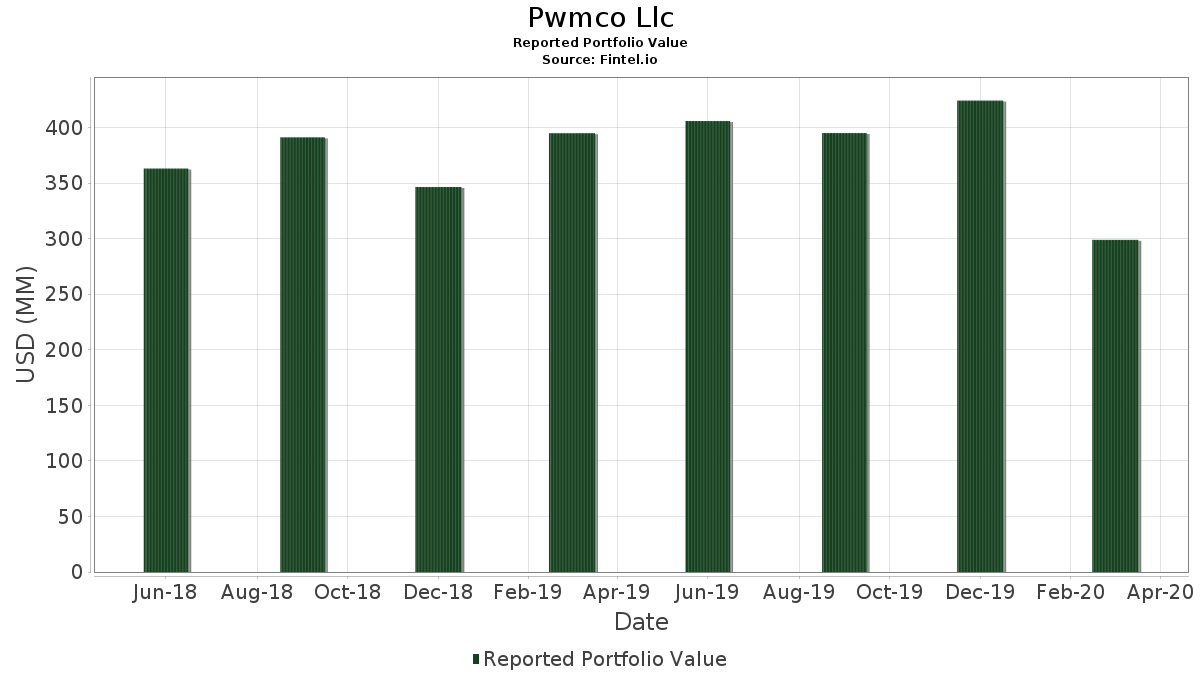
| Portfolio Value | $ 298,917,000 |
| Current Positions | 57 |
Latest Holdings, Performance, AUM (from 13F, 13D)
Pwmco Llc has disclosed 57 total holdings in their latest SEC filings. Most recent portfolio value is calculated to be $ 298,917,000 USD. Actual Assets Under Management (AUM) is this value plus cash (which is not disclosed). Pwmco Llc’s top holdings are Berkshire Hathaway Inc. (US:BRK.B) , Labcorp Holdings Inc. (US:LH) , Lamar Advertising Company (US:LAMR) , Equity LifeStyle Properties, Inc. (US:ELS) , and Sun Communities, Inc. (US:SUI) . Pwmco Llc’s new positions include F5, Inc. (US:FFIV) , Rolls-Royce Holdings plc - Depositary Receipt (Common Stock) (US:RYCEY) , Berkshire Hathaway Inc. (US:BRK.A) , Henry Schein, Inc. (US:HSIC) , and Alphabet Inc. (US:GOOGL) .
Top Increases This Quarter
We use the change in the portfolio allocation because this is the most meaningful metric. Changes can be due to trades or changes in share prices.
| Security | Shares (MM) |
Value (MM$) |
Portfolio % | ΔPortfolio % |
|---|---|---|---|---|
| 0.57 | 10.76 | 3.6010 | 3.6010 | |
| 0.06 | 6.80 | 2.2755 | 2.2755 | |
| 0.46 | 5.54 | 1.8547 | 1.8547 | |
| 0.18 | 32.63 | 10.9147 | 1.5220 | |
| 0.12 | 4.16 | 1.3920 | 1.3920 | |
| 0.24 | 30.27 | 10.1262 | 1.0810 | |
| 0.16 | 3.00 | 1.0043 | 1.0043 | |
| 0.64 | 2.74 | 0.9153 | 0.9153 | |
| 0.10 | 13.15 | 4.3999 | 0.8153 | |
| 0.05 | 12.52 | 4.1895 | 0.7652 |
Top Decreases This Quarter
We use the change in the portfolio allocation because this is the most meaningful metric. Changes can be due to trades or changes in share prices.
| Security | Shares (MM) |
Value (MM$) |
Portfolio % | ΔPortfolio % |
|---|---|---|---|---|
| 0.00 | 0.00 | -2.2186 | ||
| 0.04 | 0.52 | 0.1733 | -1.6219 | |
| 0.00 | 0.00 | -1.1958 | ||
| 0.93 | 5.20 | 1.7410 | -1.1558 | |
| 0.09 | 3.39 | 1.1328 | -0.6509 | |
| 0.39 | 20.03 | 6.7019 | -0.6295 | |
| 0.00 | 0.00 | -0.4535 | ||
| 0.10 | 2.42 | 0.8109 | -0.3830 | |
| 0.51 | 8.65 | 2.8955 | -0.3421 | |
| 0.00 | 0.00 | -0.2675 |
13F and Fund Filings
This form was filed on 2020-04-17 for the reporting period 2020-03-31. Click the link icon to see the full transaction history.
Upgrade to unlock premium data and export to Excel ![]() .
.
| Security | Type | Avg Share Price | Shares (MM) |
ΔShares (%) |
ΔShares (%) |
Value ($MM) |
Portfolio (%) |
ΔPortfolio (%) |
|
|---|---|---|---|---|---|---|---|---|---|
| BRK.B / Berkshire Hathaway Inc. | 0.18 | 1.44 | 32.63 | -18.12 | 10.9147 | 1.5220 | |||
| LH / Labcorp Holdings Inc. | 0.24 | 5.58 | 30.27 | -21.12 | 10.1262 | 1.0810 | |||
| LAMR / Lamar Advertising Company | 0.39 | 12.12 | 20.03 | -35.59 | 6.7019 | -0.6295 | |||
| ELS / Equity LifeStyle Properties, Inc. | 0.34 | -2.71 | 19.51 | -20.47 | 6.5269 | 0.7442 | |||
| SUI / Sun Communities, Inc. | 0.12 | -4.18 | 15.28 | -20.21 | 5.1115 | 0.5974 | |||
| JNJ / Johnson & Johnson | 0.10 | -3.79 | 13.15 | -13.51 | 4.3999 | 0.8153 | |||
| CASY / Casey's General Stores, Inc. | 0.10 | -3.72 | 12.74 | -19.77 | 4.2627 | 0.5190 | |||
| AAPL / Apple Inc. | 0.05 | -0.45 | 12.52 | -13.80 | 4.1895 | 0.7652 | |||
| FHN / First Horizon Corporation | 1.50 | 63.96 | 12.20 | -19.78 | 4.0804 | 0.4965 | |||
| KSU / Kansas City Southern | 0.09 | -1.62 | 11.78 | -18.27 | 3.9409 | 0.5432 | |||
| CFG / Citizens Financial Group, Inc. | 0.57 | 142.88 | 10.76 | 12.50 | 3.6010 | 3.6010 | |||
| SCHW / The Charles Schwab Corporation | 0.31 | 6.23 | 10.31 | -24.90 | 3.4491 | 0.2129 | |||
| WY / Weyerhaeuser Company | 0.51 | 12.27 | 8.65 | -36.99 | 2.8955 | -0.3421 | |||
| PCH / PotlatchDeltic Corporation | 0.24 | 2.55 | 7.39 | -25.61 | 2.4736 | 0.1308 | |||
| SLB / Schlumberger Limited | 0.53 | 93.32 | 7.31 | -34.76 | 2.4445 | -0.1956 | |||
| FFIV / F5, Inc. | 0.06 | 6.80 | 2.2755 | 2.2755 | |||||
| HOMB / Home Bancshares, Inc. (Conway, AR) | 0.46 | -21.60 | 5.54 | -52.19 | 1.8547 | 1.8547 | |||
| PAGP / Plains GP Holdings, L.P. - Limited Partnership | 0.93 | 43.05 | 5.20 | -57.65 | 1.7410 | -1.1558 | |||
| FCCO / First Community Corporation | 0.28 | -0.20 | 4.34 | -27.40 | 1.4519 | 0.0428 | |||
| COLD / Americold Realty Trust, Inc. | 0.12 | -54.81 | 4.16 | -56.14 | 1.3920 | 1.3920 | |||
| PNFP / Pinnacle Financial Partners, Inc. | 0.09 | -23.71 | 3.39 | -55.25 | 1.1328 | -0.6509 | |||
| KR / The Kroger Co. | 0.11 | -35.17 | 3.33 | -32.65 | 1.1140 | -0.0514 | |||
| CHKP / Check Point Software Technologies Ltd. | 0.03 | 104.10 | 3.01 | 84.87 | 1.0056 | 0.6224 | |||
| CNXC / Concentrix Corporation | 0.16 | 10.69 | 3.00 | -63.38 | 1.0043 | 1.0043 | |||
| RYCEY / Rolls-Royce Holdings plc - Depositary Receipt (Common Stock) | 0.64 | 2.74 | 0.9153 | 0.9153 | |||||
| BRK.A / Berkshire Hathaway Inc. | 2.72 | -19.91 | 0.9100 | 0.1094 | |||||
| BLL / Ball Corp. | 0.04 | 0.00 | 2.59 | -0.04 | 0.8651 | 0.2553 | |||
| SYK / Stryker Corporation | 0.02 | -23.79 | 2.55 | -39.57 | 0.8517 | -0.1413 | |||
| CCB Financial Corp. / Equity (124875105) | 0.24 | 2.50 | 0.0000 | ||||||
| KEM / KraneShares Trust - KraneShares Dynamic Emerging Markets Strategy ETF | 0.10 | -46.41 | 2.42 | -52.14 | 0.8109 | -0.3830 | |||
| CNS / Cohen & Steers, Inc. | 0.05 | 3.72 | 2.09 | -24.90 | 0.7002 | 0.0432 | |||
| OMCL / Omnicell, Inc. | 0.03 | 0.00 | 1.88 | -19.74 | 0.6286 | 0.0768 | |||
| SNPS / Synopsys, Inc. | 0.01 | 0.00 | 1.67 | -7.49 | 0.5580 | 0.1330 | |||
| HSIC / Henry Schein, Inc. | 0.03 | 1.66 | 0.5543 | 0.5543 | |||||
| TMO / Thermo Fisher Scientific Inc. | 0.01 | 0.00 | 1.42 | -12.68 | 0.4744 | 0.0916 | |||
| THR / Thermon Group Holdings, Inc. | 0.08 | -7.06 | 1.19 | -47.72 | 0.3984 | -0.1385 | |||
| COST / Costco Wholesale Corporation | 0.00 | 0.00 | 1.14 | -2.98 | 0.3817 | 0.1045 | |||
| KALU / Kaiser Aluminum Corporation | 0.01 | 0.00 | 1.04 | -37.52 | 0.3476 | -0.0444 | |||
| ICLR / ICON Public Limited Company | 0.01 | 0.00 | 0.82 | -21.01 | 0.2730 | 0.0295 | |||
| CSX / CSX Corporation | 0.01 | 0.00 | 0.69 | -20.74 | 0.2302 | 0.0256 | |||
| GOOGL / Alphabet Inc. | 0.00 | 0.58 | 0.1944 | 0.0364 | |||||
| GOOGL / Alphabet Inc. | 0.00 | 0.00 | 0.58 | -13.15 | 0.1944 | 0.0367 | |||
| WBA / Walgreens Boots Alliance, Inc. | 0.01 | 0.00 | 0.53 | -22.37 | 0.1776 | 0.0164 | |||
| OXY / Occidental Petroleum Corporation | 0.04 | -79.91 | 0.52 | -93.20 | 0.1733 | -1.6219 | |||
| CVGW / Calavo Growers, Inc. | 0.01 | 0.00 | 0.50 | -36.31 | 0.1673 | -0.0178 | |||
| XRAY / DENTSPLY SIRONA Inc. | 0.01 | 0.00 | 0.48 | -31.40 | 0.1623 | -0.0044 | |||
| HRL / Hormel Foods Corporation | 0.01 | 0.00 | 0.47 | 3.33 | 0.1559 | 0.0496 | |||
| IRCUF / Irish Continental Group plc - Debt/Equity Composite Units | 0.13 | 0.00 | 0.46 | -34.70 | 0.1549 | -0.0122 | |||
| UHS / Universal Health Services, Inc. | 0.00 | 0.00 | 0.40 | -14.22 | 0.1331 | 0.0238 | |||
| EVBN / Evans Bancorp, Inc. | 0.01 | 0.00 | 0.37 | -38.04 | 0.1248 | 0.1248 | |||
| CTC.A / Canadian Tire Corporation, Limited | 0.01 | 0.00 | 0.30 | -43.87 | 0.1010 | -0.0258 | |||
| FITB / Fifth Third Bancorp | 0.02 | -1.27 | 0.28 | -51.86 | 0.0950 | -0.0441 | |||
| HEP / Holly Energy Partners L.P. - Unit | 0.02 | 0.00 | 0.28 | -36.57 | 0.0940 | -0.0104 | |||
| PG / The Procter & Gamble Company | 0.00 | 0.23 | 0.0773 | 0.0773 | |||||
| LMRK / Landmark Infrastructure Partners LP - Unit | 0.02 | 0.00 | 0.22 | -35.52 | 0.0723 | -0.0067 | |||
| VTU / Vertu Motors plc | 0.79 | 0.00 | 0.20 | -48.22 | 0.0682 | -0.0246 | |||
| NANX / Solesence, Inc. | 0.39 | 0.00 | 0.08 | -24.77 | 0.0274 | 0.0017 | |||
| BKSC / Bank of South Carolina Corporation | 0.00 | -100.00 | 0.00 | -100.00 | -0.2675 | ||||
| EGP / EastGroup Properties, Inc. | 0.00 | -100.00 | 0.00 | -100.00 | -0.4535 | ||||
| WWW / Wolverine World Wide, Inc. | 0.00 | -100.00 | 0.00 | -100.00 | -0.0964 | ||||
| PLD / Prologis, Inc. | 0.00 | -100.00 | 0.00 | -100.00 | -0.0611 | ||||
| UFFCQ / UFood Restaurant Group, Inc. | 0.01 | 0.00 | 0.00 | 0.0000 | 0.0000 | ||||
| PFE / Pfizer Inc. | 0.00 | -100.00 | 0.00 | -100.00 | -1.1958 | ||||
| GPK / Graphic Packaging Holding Company | 0.00 | -100.00 | 0.00 | -100.00 | -2.2186 | ||||
| FBNC / First Bancorp | 0.00 | -100.00 | 0.00 | -100.00 | -0.0651 | ||||
| AVX / AVX Corp. | 0.00 | -100.00 | 0.00 | 0.0000 | |||||
| RMR Real Estate Fd Fractional Shares / Equity (HGK70B105) | 0.17 | 0.00 | 0.0000 | ||||||
| Tradeshow Marketing Co. / Equity (892652108) | 0.03 | 0.00 | 0.0000 |