Basic Stats
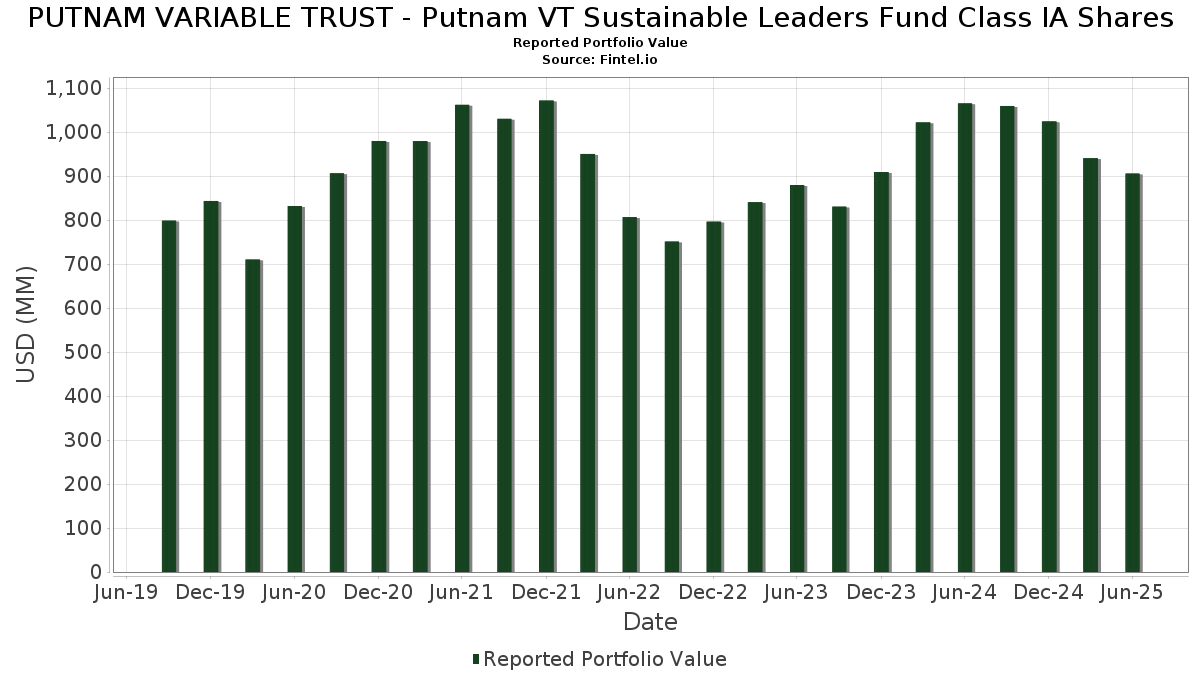
| Portfolio Value | $ 905,804,007 |
| Current Positions | 91 |
Latest Holdings, Performance, AUM (from 13F, 13D)
PUTNAM VARIABLE TRUST - Putnam VT Sustainable Leaders Fund Class IA Shares has disclosed 91 total holdings in their latest SEC filings. Most recent portfolio value is calculated to be $ 905,804,007 USD. Actual Assets Under Management (AUM) is this value plus cash (which is not disclosed). PUTNAM VARIABLE TRUST - Putnam VT Sustainable Leaders Fund Class IA Shares’s top holdings are Microsoft Corporation (US:MSFT) , Apple Inc. (US:AAPL) , NVIDIA Corporation (US:NVDA) , Amazon.com, Inc. (US:AMZN) , and Broadcom Inc. (US:AVGO) . PUTNAM VARIABLE TRUST - Putnam VT Sustainable Leaders Fund Class IA Shares’s new positions include Keurig Dr Pepper Inc. (US:KDP) , D.R. Horton, Inc. (US:DHI) , Costco Wholesale Corporation (US:COST) , Ralliant Corporation (US:RAL) , and .
Top Increases This Quarter
We use the change in the portfolio allocation because this is the most meaningful metric. Changes can be due to trades or changes in share prices.
| Security | Shares (MM) |
Value (MM$) |
Portfolio % | ΔPortfolio % |
|---|---|---|---|---|
| 0.17 | 83.37 | 9.1779 | 1.8076 | |
| 0.35 | 55.41 | 6.0998 | 1.6536 | |
| 0.12 | 33.82 | 3.7235 | 1.3169 | |
| 0.29 | 9.43 | 1.0387 | 1.0387 | |
| 0.17 | 13.26 | 1.4597 | 0.9879 | |
| 0.06 | 18.43 | 2.0289 | 0.8479 | |
| 20.64 | 20.64 | 2.2723 | 0.7916 | |
| 0.05 | 6.83 | 0.7522 | 0.7522 | |
| 0.14 | 16.82 | 1.8513 | 0.7101 | |
| 0.01 | 6.24 | 0.6866 | 0.6866 |
Top Decreases This Quarter
We use the change in the portfolio allocation because this is the most meaningful metric. Changes can be due to trades or changes in share prices.
| Security | Shares (MM) |
Value (MM$) |
Portfolio % | ΔPortfolio % |
|---|---|---|---|---|
| 0.31 | 63.42 | 6.9815 | -1.8994 | |
| 0.05 | 5.18 | 0.5701 | -1.1188 | |
| 0.08 | 4.00 | 0.4402 | -0.8997 | |
| 0.02 | 17.38 | 1.9138 | -0.5534 | |
| 0.02 | 8.51 | 0.9374 | -0.5374 | |
| 0.34 | 16.19 | 1.7822 | -0.5086 | |
| 0.03 | 19.05 | 2.0972 | -0.4712 | |
| 0.20 | 3.87 | 0.4258 | -0.4339 | |
| 0.02 | 9.78 | 1.0768 | -0.3620 | |
| 0.04 | 14.67 | 1.6146 | -0.3174 |
13F and Fund Filings
This form was filed on 2025-08-26 for the reporting period 2025-06-30. Click the link icon to see the full transaction history.
Upgrade to unlock premium data and export to Excel ![]() .
.
| Security | Type | Avg Share Price | Shares (MM) |
ΔShares (%) |
ΔShares (%) |
Value ($MM) |
Portfolio (%) |
ΔPortfolio (%) |
|
|---|---|---|---|---|---|---|---|---|---|
| MSFT / Microsoft Corporation | 0.17 | 0.00 | 83.37 | 32.50 | 9.1779 | 1.8076 | |||
| AAPL / Apple Inc. | 0.31 | -9.43 | 63.42 | -16.35 | 6.9815 | -1.8994 | |||
| NVDA / NVIDIA Corporation | 0.35 | 0.14 | 55.41 | 45.98 | 6.0998 | 1.6536 | |||
| AMZN / Amazon.com, Inc. | 0.25 | -2.98 | 55.04 | 11.88 | 6.0600 | 0.2962 | |||
| AVGO / Broadcom Inc. | 0.12 | 0.00 | 33.82 | 64.64 | 3.7235 | 1.3169 | |||
| JPM / JPMorgan Chase & Co. | 0.09 | 0.00 | 26.41 | 18.19 | 2.9076 | 0.2898 | |||
| US74676P6640 / SHORT TERM INV FUND | 20.64 | 63.29 | 20.64 | 63.29 | 2.2723 | 0.7916 | |||
| WMT / Walmart Inc. | 0.20 | 0.00 | 19.94 | 11.38 | 2.1949 | 0.0980 | |||
| MA / Mastercard Incorporated | 0.03 | -15.25 | 19.05 | -13.11 | 2.0972 | -0.4712 | |||
| CEG / Constellation Energy Corporation | 0.06 | 14.20 | 18.43 | 82.81 | 2.0289 | 0.8479 | |||
| LLY / Eli Lilly and Company | 0.02 | -12.55 | 17.38 | -17.46 | 1.9138 | -0.5534 | |||
| DIS / The Walt Disney Company | 0.14 | 37.39 | 16.82 | 72.62 | 1.8513 | 0.7101 | |||
| BAC / Bank of America Corporation | 0.34 | -27.00 | 16.19 | -17.21 | 1.7822 | -0.5086 | |||
| BSX / Boston Scientific Corporation | 0.15 | -12.50 | 16.01 | -6.84 | 1.7631 | -0.2506 | |||
| UNA / Unilever PLC | 0.26 | 0.00 | 15.98 | 2.44 | 1.7589 | -0.0681 | |||
| ROP / Roper Technologies, Inc. | 0.03 | 0.00 | 15.81 | -3.86 | 1.7411 | -0.1859 | |||
| KR / The Kroger Co. | 0.21 | 25.39 | 14.98 | 32.87 | 1.6497 | 0.3286 | |||
| HLT / Hilton Worldwide Holdings Inc. | 0.06 | -12.93 | 14.70 | 1.91 | 1.6185 | -0.0715 | |||
| HD / The Home Depot, Inc. | 0.04 | -11.11 | 14.67 | -11.08 | 1.6146 | -0.3174 | |||
| CRM / Salesforce, Inc. | 0.05 | 0.00 | 14.37 | 1.61 | 1.5821 | -0.0746 | |||
| NEE / NextEra Energy, Inc. | 0.21 | 15.94 | 14.34 | 13.54 | 1.5789 | 0.0991 | |||
| COF / Capital One Financial Corporation | 0.07 | -7.49 | 13.94 | 9.78 | 1.5342 | 0.0471 | |||
| LIN / Linde plc | 0.03 | -11.80 | 13.32 | -11.13 | 1.4669 | -0.2895 | |||
| MRVL / Marvell Technology, Inc. | 0.17 | 161.93 | 13.26 | 229.31 | 1.4597 | 0.9879 | |||
| IR / Ingersoll Rand Inc. | 0.16 | 23.52 | 13.23 | 28.39 | 1.4569 | 0.2494 | |||
| RSG / Republic Services, Inc. | 0.05 | 80.47 | 13.22 | 83.79 | 1.4552 | 0.6127 | |||
| NZM2 / Novozymes A/S | 0.17 | 12.25 | 12.36 | 38.42 | 1.3605 | 0.3146 | |||
| BALL / Ball Corporation | 0.22 | 17.94 | 12.35 | 27.05 | 1.3597 | 0.2209 | |||
| PLD / Prologis, Inc. | 0.12 | 0.00 | 12.09 | -5.97 | 1.3309 | -0.1751 | |||
| KKR / KKR & Co. Inc. | 0.09 | 39.36 | 11.59 | 60.36 | 1.2756 | 0.4292 | |||
| CMG / Chipotle Mexican Grill, Inc. | 0.19 | -1.37 | 10.94 | 10.31 | 1.2042 | 0.0425 | |||
| BN / Danone S.A. | 0.13 | -14.61 | 10.75 | -8.66 | 1.1839 | -0.1952 | |||
| AMAT / Applied Materials, Inc. | 0.06 | 23.87 | 10.07 | 56.26 | 1.1085 | 0.3537 | |||
| LSE N / London Stock Exchange Group plc | 0.07 | 0.00 | 9.82 | -1.53 | 1.0811 | -0.0872 | |||
| ISRG / Intuitive Surgical, Inc. | 0.02 | -27.42 | 9.78 | -20.36 | 1.0768 | -0.3620 | |||
| ACN / Accenture plc | 0.03 | 0.00 | 9.56 | -4.22 | 1.0530 | -0.1168 | |||
| KDP / Keurig Dr Pepper Inc. | 0.29 | 9.43 | 1.0387 | 1.0387 | |||||
| NOW / ServiceNow, Inc. | 0.01 | 0.00 | 9.36 | 29.14 | 1.0300 | 0.1813 | |||
| AMT / American Tower Corporation | 0.04 | -19.89 | 9.26 | -23.86 | 1.0195 | -0.2192 | |||
| CDNS / Cadence Design Systems, Inc. | 0.03 | -19.14 | 9.24 | -2.02 | 1.0177 | -0.0876 | |||
| STX / Seagate Technology Holdings plc | 0.06 | -35.66 | 9.16 | 9.30 | 1.0090 | 0.0268 | |||
| TMO / Thermo Fisher Scientific Inc. | 0.02 | -17.00 | 8.51 | -32.37 | 0.9374 | -0.5374 | |||
| MTD / Mettler-Toledo International Inc. | 0.01 | 0.00 | 8.34 | -0.52 | 0.9182 | -0.0640 | |||
| TPG / TPG Inc. | 0.16 | -8.08 | 8.17 | 1.64 | 0.8994 | -0.0422 | |||
| AZN / Astrazeneca plc | 0.06 | -10.62 | 7.87 | -15.29 | 0.8662 | -0.2219 | |||
| CRH / CRH plc | 0.09 | -18.67 | 7.84 | -15.13 | 0.8631 | -0.2190 | |||
| ASML / ASML Holding N.V. - Depositary Receipt (Common Stock) | 0.01 | 33.33 | 7.37 | 61.24 | 0.8117 | 0.2761 | |||
| CP / Canadian Pacific Kansas City Limited | 0.09 | 41.76 | 7.31 | 60.47 | 0.8046 | 0.2711 | |||
| DHI / D.R. Horton, Inc. | 0.05 | 6.83 | 0.7522 | 0.7522 | |||||
| MSCI / MSCI Inc. | 0.01 | 126.92 | 6.81 | 131.46 | 0.7492 | 0.4048 | |||
| COST / Costco Wholesale Corporation | 0.01 | 6.24 | 0.6866 | 0.6866 | |||||
| BXP / Boston Properties, Inc. | 0.09 | 16.82 | 6.19 | 20.68 | 0.6811 | 0.1403 | |||
| FSV / FirstService Corporation | 0.03 | 0.00 | 5.78 | 5.23 | 0.6363 | -0.0072 | |||
| OTIS / Otis Worldwide Corporation | 0.05 | -62.56 | 5.18 | -64.08 | 0.5701 | -1.1188 | |||
| REGN / Regeneron Pharmaceuticals, Inc. | 0.01 | 0.00 | 4.72 | -17.22 | 0.5202 | -0.1485 | |||
| FTV / Fortive Corporation | 0.08 | -50.93 | 4.00 | -65.05 | 0.4402 | -0.8997 | |||
| CH1134540470 / On Holding AG | 0.08 | 0.00 | 3.99 | 18.52 | 0.4389 | 0.0448 | |||
| GSK / GSK plc | 0.20 | -47.18 | 3.87 | -47.31 | 0.4258 | -0.4339 | |||
| SAN / Santander UK plc - Preferred Stock | 0.04 | -30.51 | 3.60 | -39.24 | 0.3962 | -0.2977 | |||
| U.S. Treasury Bills / STIV (US912797QP55) | 2.46 | 0.2712 | 0.2712 | ||||||
| U.S. Treasury Bills / STIV (US912797MS31) | 2.27 | 0.2504 | 0.2504 | ||||||
| RAL / Ralliant Corporation | 0.03 | 1.24 | 0.1365 | 0.1365 | |||||
| U.S. Treasury Bills / STIV (US912797QS94) | 0.10 | 0.0108 | 0.0108 | ||||||
| Forward Foreign Currency Contract / DFE (N/A) | 0.04 | 0.0047 | 0.0047 | ||||||
| Forward Foreign Currency Contract / DFE (N/A) | 0.03 | 0.0038 | 0.0038 | ||||||
| Forward Foreign Currency Contract / DFE (N/A) | 0.03 | 0.0037 | 0.0037 | ||||||
| Forward Foreign Currency Contract / DFE (N/A) | 0.01 | 0.0014 | 0.0014 | ||||||
| Forward Foreign Currency Contract / DFE (N/A) | 0.01 | 0.0008 | 0.0008 | ||||||
| Forward Foreign Currency Contract / DFE (N/A) | 0.00 | 0.0003 | 0.0003 | ||||||
| Forward Foreign Currency Contract / DFE (N/A) | -0.00 | -0.0001 | -0.0001 | ||||||
| Forward Foreign Currency Contract / DFE (N/A) | -0.01 | -0.0009 | -0.0009 | ||||||
| Forward Foreign Currency Contract / DFE (N/A) | -0.04 | -0.0039 | -0.0039 | ||||||
| Forward Foreign Currency Contract / DFE (N/A) | -0.04 | -0.0041 | -0.0041 | ||||||
| Forward Foreign Currency Contract / DFE (N/A) | -0.04 | -0.0045 | -0.0045 | ||||||
| Forward Foreign Currency Contract / DFE (N/A) | -0.04 | -0.0049 | -0.0049 | ||||||
| Forward Foreign Currency Contract / DFE (N/A) | -0.05 | -0.0060 | -0.0060 | ||||||
| Forward Foreign Currency Contract / DFE (N/A) | -0.07 | -0.0078 | -0.0078 | ||||||
| Forward Foreign Currency Contract / DFE (N/A) | -0.07 | -0.0082 | -0.0082 | ||||||
| Forward Foreign Currency Contract / DFE (N/A) | -0.08 | -0.0091 | -0.0091 | ||||||
| Forward Foreign Currency Contract / DFE (N/A) | -0.09 | -0.0094 | -0.0094 | ||||||
| Forward Foreign Currency Contract / DFE (N/A) | -0.09 | -0.0104 | -0.0104 | ||||||
| Forward Foreign Currency Contract / DFE (N/A) | -0.12 | -0.0134 | -0.0134 | ||||||
| Forward Foreign Currency Contract / DFE (N/A) | -0.13 | -0.0148 | -0.0148 | ||||||
| Forward Foreign Currency Contract / DFE (N/A) | -0.14 | -0.0152 | -0.0152 | ||||||
| Forward Foreign Currency Contract / DFE (N/A) | -0.15 | -0.0165 | -0.0165 | ||||||
| Forward Foreign Currency Contract / DFE (N/A) | -0.15 | -0.0166 | -0.0166 | ||||||
| Forward Foreign Currency Contract / DFE (N/A) | -0.16 | -0.0179 | -0.0179 | ||||||
| Forward Foreign Currency Contract / DFE (N/A) | -0.19 | -0.0210 | -0.0210 | ||||||
| Forward Foreign Currency Contract / DFE (N/A) | -0.23 | -0.0258 | -0.0258 | ||||||
| Forward Foreign Currency Contract / DFE (N/A) | -0.29 | -0.0315 | -0.0315 | ||||||
| Forward Foreign Currency Contract / DFE (N/A) | -0.35 | -0.0381 | -0.0381 |