Basic Stats
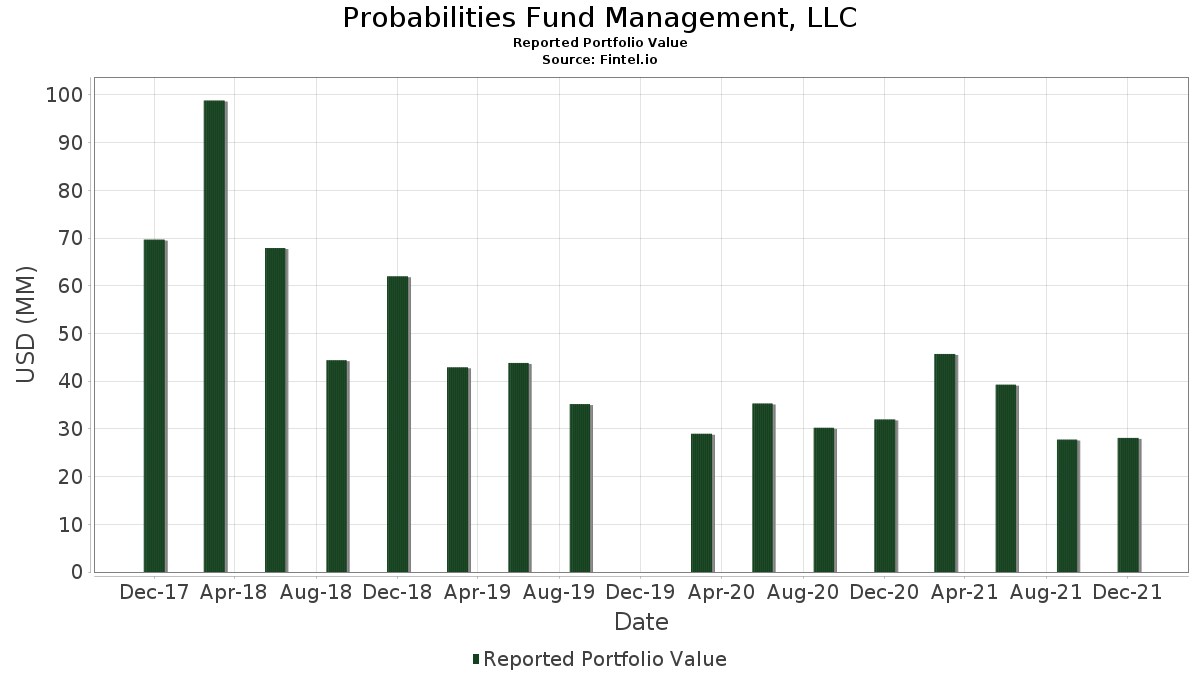
| Portfolio Value | $ 28,105,000 |
| Current Positions | 11 |
Latest Holdings, Performance, AUM (from 13F, 13D)
Probabilities Fund Management, LLC has disclosed 11 total holdings in their latest SEC filings. Most recent portfolio value is calculated to be $ 28,105,000 USD. Actual Assets Under Management (AUM) is this value plus cash (which is not disclosed). Probabilities Fund Management, LLC’s top holdings are Invesco QQQ Trust, Series 1 (US:QQQ) , Vanguard Index Funds - Vanguard S&P 500 ETF (US:VOO) , SPDR Dow Jones Industrial Average ETF Trust (US:DIA) , ProShares Trust - ProShares UltraPro Dow30 (US:UDOW) , and Direxion Shares ETF Trust - Direxion Daily S&P 500 Bull 3X Shares (US:SPXL) .
Top Increases This Quarter
We use the change in the portfolio allocation because this is the most meaningful metric. Changes can be due to trades or changes in share prices.
| Security | Shares (MM) |
Value (MM$) |
Portfolio % | ΔPortfolio % |
|---|---|---|---|---|
| 0.00 | 1.25 | 4.4512 | 0.6706 | |
| 0.03 | 2.69 | 9.5570 | 0.3524 | |
| 0.00 | 0.42 | 1.4944 | 0.2546 | |
| 0.00 | 0.41 | 1.4517 | 0.2191 | |
| 0.02 | 2.67 | 9.4965 | 0.1658 | |
| 0.01 | 5.67 | 20.1566 | 0.0319 |
Top Decreases This Quarter
We use the change in the portfolio allocation because this is the most meaningful metric. Changes can be due to trades or changes in share prices.
| Security | Shares (MM) |
Value (MM$) |
Portfolio % | ΔPortfolio % |
|---|---|---|---|---|
| 0.01 | 5.44 | 19.3524 | -0.8011 | |
| 0.00 | 1.10 | 3.9281 | -0.4039 | |
| 0.01 | 5.59 | 19.8826 | -0.2601 | |
| 0.02 | 2.63 | 9.3435 | -0.2179 | |
| 0.00 | 0.25 | 0.8860 | -0.0114 |
13F and Fund Filings
This form was filed on 2022-02-11 for the reporting period 2021-12-31. Click the link icon to see the full transaction history.
Upgrade to unlock premium data and export to Excel ![]() .
.
| Security | Type | Avg Share Price | Shares (MM) |
ΔShares (%) |
ΔShares (%) |
Value ($MM) |
Portfolio (%) |
ΔPortfolio (%) |
|
|---|---|---|---|---|---|---|---|---|---|
| QQQ / Invesco QQQ Trust, Series 1 | 0.01 | -8.72 | 5.67 | 1.45 | 20.1566 | 0.0319 | |||
| VOO / Vanguard Index Funds - Vanguard S&P 500 ETF | 0.01 | -9.67 | 5.59 | -0.02 | 19.8826 | -0.2601 | |||
| DIA / SPDR Dow Jones Industrial Average ETF Trust | 0.01 | -9.44 | 5.44 | -2.74 | 19.3524 | -0.8011 | |||
| UDOW / ProShares Trust - ProShares UltraPro Dow30 | 0.03 | -14.54 | 2.69 | 5.17 | 9.5570 | 0.3524 | |||
| SPXL / Direxion Shares ETF Trust - Direxion Daily S&P 500 Bull 3X Shares | 0.02 | -23.10 | 2.67 | 3.09 | 9.4965 | 0.1658 | |||
| TQQQ / ProShares Trust - ProShares UltraPro QQQ | 0.02 | -25.87 | 2.63 | -1.02 | 9.3435 | -0.2179 | |||
| MSFT / Microsoft Corporation | 0.00 | 0.00 | 1.25 | 19.26 | 4.4512 | 0.6706 | |||
| IIPR / Innovative Industrial Properties, Inc. | 0.00 | -19.23 | 1.10 | -8.15 | 3.9281 | -0.4039 | |||
| AMAT / Applied Materials, Inc. | 0.00 | 0.00 | 0.42 | 22.09 | 1.4944 | 0.2546 | |||
| STZ / Constellation Brands, Inc. | 0.00 | 0.00 | 0.41 | 19.30 | 1.4517 | 0.2191 | |||
| AAPL / Apple Inc. | 0.00 | -20.45 | 0.25 | 0.00 | 0.8860 | -0.0114 |