Basic Stats
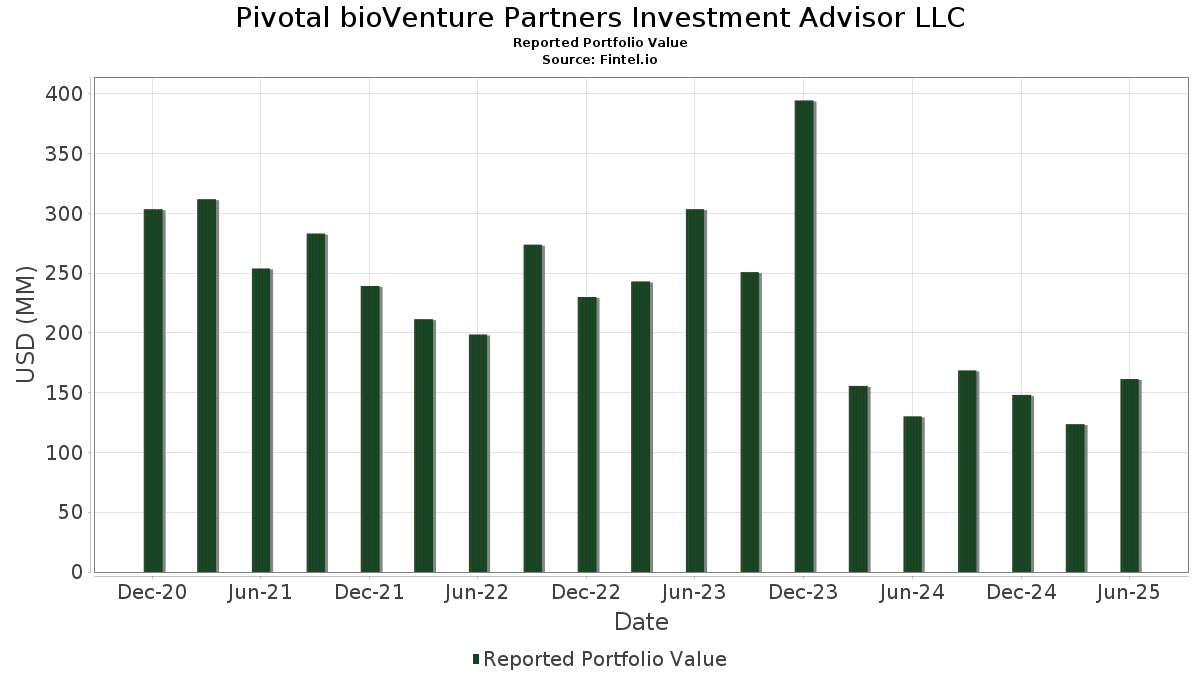
| Portfolio Value | $ 161,342,907 |
| Current Positions | 12 |
Latest Holdings, Performance, AUM (from 13F, 13D)
Pivotal bioVenture Partners Investment Advisor LLC has disclosed 12 total holdings in their latest SEC filings. Most recent portfolio value is calculated to be $ 161,342,907 USD. Actual Assets Under Management (AUM) is this value plus cash (which is not disclosed). Pivotal bioVenture Partners Investment Advisor LLC’s top holdings are Oculis Holding AG (US:OCS) , Vaxcyte, Inc. (US:PCVX) , Arcutis Biotherapeutics, Inc. (US:ARQT) , Inozyme Pharma, Inc. (US:INZY) , and Zenas BioPharma, Inc. (US:ZBIO) . Pivotal bioVenture Partners Investment Advisor LLC’s new positions include Trevi Therapeutics, Inc. (US:TRVI) , Bolt Biotherapeutics, Inc. (US:BOLT) , .
Top Increases This Quarter
We use the change in the portfolio allocation because this is the most meaningful metric. Changes can be due to trades or changes in share prices.
| Security | Shares (MM) |
Value (MM$) |
Portfolio % | ΔPortfolio % |
|---|---|---|---|---|
| 4.49 | 17.98 | 11.1436 | 7.8333 | |
| 1.31 | 42.43 | 26.2978 | 4.5781 | |
| 1.15 | 6.27 | 3.8857 | 3.8857 | |
| 0.56 | 4.46 | 2.7623 | 1.9547 | |
| 0.09 | 0.55 | 0.3382 | 0.3382 |
Top Decreases This Quarter
We use the change in the portfolio allocation because this is the most meaningful metric. Changes can be due to trades or changes in share prices.
| Security | Shares (MM) |
Value (MM$) |
Portfolio % | ΔPortfolio % |
|---|---|---|---|---|
| 2.12 | 29.73 | 18.4263 | -8.4143 | |
| 2.30 | 44.66 | 27.6790 | -7.7557 | |
| 2.40 | 0.81 | 0.5038 | -0.7612 | |
| 0.60 | 3.01 | 1.8677 | -0.6819 | |
| 0.65 | 2.70 | 1.6725 | -0.3157 | |
| 0.78 | 7.55 | 4.6788 | -0.0310 | |
| 0.86 | 1.20 | 0.7445 | -0.0178 |
13F and Fund Filings
This form was filed on 2025-08-13 for the reporting period 2025-06-30. Click the link icon to see the full transaction history.
Upgrade to unlock premium data and export to Excel ![]() .
.
| Security | Type | Avg Share Price | Shares (MM) |
ΔShares (%) |
ΔShares (%) |
Value ($MM) |
Portfolio (%) |
ΔPortfolio (%) |
|
|---|---|---|---|---|---|---|---|---|---|
| OCS / Oculis Holding AG | 2.30 | 0.00 | 44.66 | 2.00 | 27.6790 | -7.7557 | |||
| PCVX / Vaxcyte, Inc. | 1.31 | 83.63 | 42.43 | 58.10 | 26.2978 | 4.5781 | |||
| ARQT / Arcutis Biotherapeutics, Inc. | 2.12 | 0.00 | 29.73 | -10.36 | 18.4263 | -8.4143 | |||
| INZY / Inozyme Pharma, Inc. | 4.49 | 0.00 | 17.98 | 339.58 | 11.1436 | 7.8333 | |||
| ZBIO / Zenas BioPharma, Inc. | 0.78 | 5.76 | 7.55 | 29.71 | 4.6788 | -0.0310 | |||
| TRVI / Trevi Therapeutics, Inc. | 1.15 | 6.27 | 3.8857 | 3.8857 | |||||
| VIGL / Vigil Neuroscience, Inc. | 0.56 | 0.00 | 4.46 | 346.94 | 2.7623 | 1.9547 | |||
| RXRX / Recursion Pharmaceuticals, Inc. | 0.60 | 0.00 | 3.01 | -4.35 | 1.8677 | -0.6819 | |||
| BIOA / BioAge Labs, Inc. | 0.65 | 0.00 | 2.70 | 9.85 | 1.6725 | -0.3157 | |||
| IOBT / IO Biotech, Inc. | 0.86 | 0.00 | 1.20 | 27.63 | 0.7445 | -0.0178 | |||
| RLYB / Rallybio Corporation | 2.40 | 0.00 | 0.81 | -48.05 | 0.5038 | -0.7612 | |||
| BOLT / Bolt Biotherapeutics, Inc. | 0.09 | 0.55 | 0.3382 | 0.3382 | |||||
| BOLT / Bolt Biotherapeutics, Inc. | 0.00 | -100.00 | 0.00 | 0.0000 |