Basic Stats
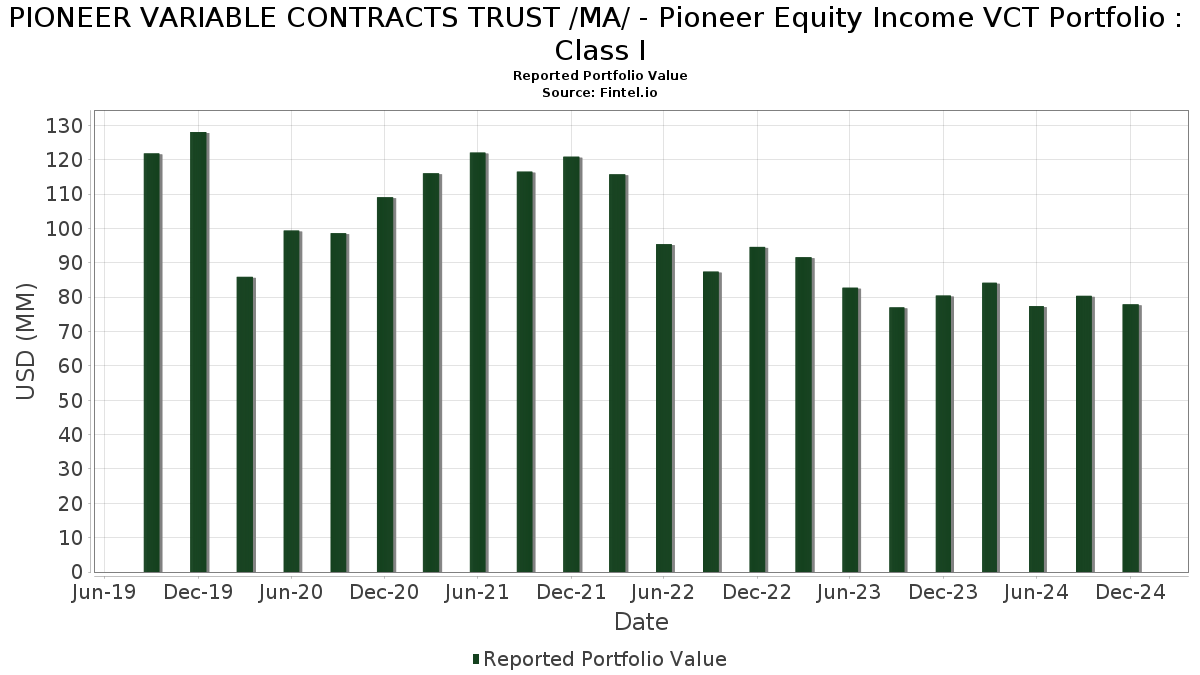
| Portfolio Value | $ 77,933,504 |
| Current Positions | 56 |
Latest Holdings, Performance, AUM (from 13F, 13D)
PIONEER VARIABLE CONTRACTS TRUST /MA/ - Pioneer Equity Income VCT Portfolio : Class I has disclosed 56 total holdings in their latest SEC filings. Most recent portfolio value is calculated to be $ 77,933,504 USD. Actual Assets Under Management (AUM) is this value plus cash (which is not disclosed). PIONEER VARIABLE CONTRACTS TRUST /MA/ - Pioneer Equity Income VCT Portfolio : Class I’s top holdings are Exxon Mobil Corporation (US:XOM) , Wells Fargo & Company (US:WFC) , United Parcel Service, Inc. (US:UPS) , International Business Machines Corporation (US:IBM) , and The Walt Disney Company (US:DIS) . PIONEER VARIABLE CONTRACTS TRUST /MA/ - Pioneer Equity Income VCT Portfolio : Class I’s new positions include Host Hotels & Resorts, Inc. (US:HST) , Prudential Financial, Inc. (US:PRU) , Molson Coors Beverage Company (US:TAP) , Corebridge Financial, Inc. (US:US21871X1090) , and The Cigna Group (US:CI) .
Top Increases This Quarter
We use the change in the portfolio allocation because this is the most meaningful metric. Changes can be due to trades or changes in share prices.
| Security | Shares (MM) |
Value (MM$) |
Portfolio % | ΔPortfolio % |
|---|---|---|---|---|
| 0.01 | 0.79 | 1.0115 | 1.0115 | |
| 0.03 | 0.60 | 0.7731 | 0.7731 | |
| 0.01 | 0.60 | 0.7676 | 0.7676 | |
| 0.03 | 1.01 | 1.3034 | 0.7616 | |
| 0.03 | 1.22 | 1.5651 | 0.7398 | |
| 0.00 | 0.53 | 0.6867 | 0.6867 | |
| 0.02 | 2.83 | 3.6409 | 0.6808 | |
| 0.05 | 2.39 | 3.0723 | 0.6629 | |
| 0.02 | 1.99 | 2.5569 | 0.6618 | |
| 0.01 | 0.50 | 0.6484 | 0.6484 |
Top Decreases This Quarter
We use the change in the portfolio allocation because this is the most meaningful metric. Changes can be due to trades or changes in share prices.
| Security | Shares (MM) |
Value (MM$) |
Portfolio % | ΔPortfolio % |
|---|---|---|---|---|
| 0.00 | 0.77 | 0.9911 | -1.8506 | |
| 0.00 | 0.00 | -1.4350 | ||
| 0.01 | 0.36 | 0.4601 | -1.0159 | |
| 0.02 | 2.35 | 3.0248 | -0.8700 | |
| 0.04 | 2.14 | 2.7485 | -0.7591 | |
| 0.02 | 1.57 | 2.0106 | -0.7167 | |
| 0.03 | 3.30 | 4.2345 | -0.6046 | |
| 0.01 | 0.76 | 0.9819 | -0.5663 | |
| 0.00 | 0.38 | 0.4855 | -0.5080 | |
| 0.02 | 1.57 | 2.0147 | -0.4554 |
13F and Fund Filings
This form was filed on 2025-02-25 for the reporting period 2024-12-31. Click the link icon to see the full transaction history.
Upgrade to unlock premium data and export to Excel ![]() .
.
| Security | Type | Avg Share Price | Shares (MM) |
ΔShares (%) |
ΔShares (%) |
Value ($MM) |
Portfolio (%) |
ΔPortfolio (%) |
|
|---|---|---|---|---|---|---|---|---|---|
| XOM / Exxon Mobil Corporation | 0.03 | -7.73 | 3.30 | -15.34 | 4.2345 | -0.6046 | |||
| WFC / Wells Fargo & Company | 0.05 | -22.61 | 3.29 | -3.77 | 4.2293 | -0.0236 | |||
| UPS / United Parcel Service, Inc. | 0.02 | 28.69 | 2.83 | 19.03 | 3.6409 | 0.6808 | |||
| IBM / International Business Machines Corporation | 0.01 | -1.96 | 2.49 | -2.50 | 3.2015 | 0.0235 | |||
| DIS / The Walt Disney Company | 0.02 | -7.27 | 2.43 | 7.32 | 3.1265 | 0.3080 | |||
| COG / Cabot Oil & Gas Corp. | 0.09 | 0.00 | 2.42 | 6.61 | 3.1084 | 0.2877 | |||
| BAC / Bank of America Corporation | 0.05 | 11.40 | 2.39 | 23.37 | 3.0723 | 0.6629 | |||
| JNJ / Johnson & Johnson | 0.02 | -15.78 | 2.35 | -24.86 | 3.0248 | -0.8700 | |||
| STT / State Street Corporation | 0.02 | 7.76 | 2.31 | 19.53 | 2.9642 | 0.5650 | |||
| AIG / American International Group, Inc. | 0.03 | 17.91 | 2.14 | 17.25 | 2.7507 | 0.4800 | |||
| CSCO / Cisco Systems, Inc. | 0.04 | -31.83 | 2.14 | -24.18 | 2.7485 | -0.7591 | |||
| MMM / 3M Company | 0.02 | 38.26 | 1.99 | 30.58 | 2.5569 | 0.6618 | |||
| MS / Morgan Stanley | 0.02 | 6.50 | 1.94 | 28.42 | 2.4964 | 0.6157 | |||
| JPM / JPMorgan Chase & Co. | 0.01 | 0.00 | 1.94 | 13.68 | 2.4876 | 0.3701 | |||
| TGT / Target Corporation | 0.01 | 38.81 | 1.91 | 20.39 | 2.4499 | 0.4808 | |||
| NTRS / Northern Trust Corporation | 0.02 | -26.81 | 1.90 | -16.70 | 2.4427 | -0.3940 | |||
| ROK / Rockwell Automation, Inc. | 0.01 | 23.56 | 1.87 | 31.60 | 2.4023 | 0.6351 | |||
| RJF / Raymond James Financial, Inc. | 0.01 | -20.76 | 1.81 | 0.56 | 2.3224 | 0.0865 | |||
| EBAY / eBay Inc. | 0.03 | -2.85 | 1.78 | -7.54 | 2.2831 | -0.1070 | |||
| ES / Eversource Energy | 0.03 | 51.13 | 1.72 | 27.58 | 2.2117 | 0.5337 | |||
| SNY / Sanofi - Depositary Receipt (Common Stock) | 0.03 | 14.80 | 1.65 | -3.97 | 2.1153 | -0.0152 | |||
| MDT / Medtronic plc | 0.02 | -1.45 | 1.57 | -12.56 | 2.0218 | -0.2157 | |||
| LYB / LyondellBasell Industries N.V. | 0.02 | 1.92 | 1.57 | -21.09 | 2.0147 | -0.4554 | |||
| COP / ConocoPhillips | 0.02 | -24.26 | 1.57 | -28.67 | 2.0106 | -0.7167 | |||
| BMY / Bristol-Myers Squibb Company | 0.03 | 0.00 | 1.55 | 9.32 | 1.9909 | 0.2285 | |||
| TFC / Truist Financial Corporation | 0.03 | 8.53 | 1.49 | 10.10 | 1.9192 | 0.2321 | |||
| DGCXX / Dreyfus Government Cash Management Funds - Dreyfus Government Cash Management Fund Institutional Shares | 1.43 | 18.66 | 1.43 | 18.69 | 1.8366 | 0.3389 | |||
| UNP / Union Pacific Corporation | 0.01 | -13.80 | 1.41 | -20.21 | 1.8152 | -0.3873 | |||
| TJX / The TJX Companies, Inc. | 0.01 | 0.00 | 1.39 | 2.81 | 1.7875 | 0.1046 | |||
| CMS / CMS Energy Corporation | 0.02 | -17.26 | 1.33 | -21.95 | 1.7040 | -0.4079 | |||
| VZ / Verizon Communications Inc. | 0.03 | 106.10 | 1.22 | 83.71 | 1.5651 | 0.7398 | |||
| KMB / Kimberly-Clark Corporation | 0.01 | 42.28 | 1.15 | 31.09 | 1.4789 | 0.3868 | |||
| HSY / The Hershey Company | 0.01 | 8.20 | 1.14 | -4.46 | 1.4583 | -0.0187 | |||
| SBUX / Starbucks Corporation | 0.01 | 6.54 | 1.10 | -0.27 | 1.4147 | 0.0419 | |||
| CMCSA / Comcast Corporation | 0.03 | 159.10 | 1.01 | 133.10 | 1.3034 | 0.7616 | |||
| PEP / PepsiCo, Inc. | 0.01 | 79.33 | 0.92 | 60.49 | 1.1793 | 0.4677 | |||
| RF / Regions Financial Corporation | 0.03 | -24.36 | 0.79 | -23.79 | 1.0130 | -0.2725 | |||
| GPC / Genuine Parts Company | 0.01 | 0.79 | 1.0115 | 1.0115 | |||||
| DE / Deere & Company | 0.00 | -66.76 | 0.77 | -66.27 | 0.9911 | -1.8506 | |||
| CPT / Camden Property Trust | 0.01 | 0.00 | 0.76 | -6.14 | 0.9823 | -0.0296 | |||
| DGX / Quest Diagnostics Incorporated | 0.01 | -36.84 | 0.76 | -38.63 | 0.9819 | -0.5663 | |||
| F / Ford Motor Company | 0.08 | 7.62 | 0.76 | 0.79 | 0.9787 | 0.0400 | |||
| PCAR / PACCAR Inc | 0.01 | -37.16 | 0.75 | -21.80 | 0.9585 | -0.1937 | |||
| MCHP / Microchip Technology Incorporated | 0.01 | 64.27 | 0.72 | 17.29 | 0.9241 | 0.1620 | |||
| HST / Host Hotels & Resorts, Inc. | 0.03 | 0.60 | 0.7731 | 0.7731 | |||||
| CPB / The Campbell's Company | 0.01 | 0.60 | 0.7676 | 0.7676 | |||||
| PRU / Prudential Financial, Inc. | 0.00 | 0.53 | 0.6867 | 0.6867 | |||||
| JBSS / John B. Sanfilippo & Son, Inc. | 0.01 | 0.00 | 0.51 | -7.59 | 0.6568 | -0.0313 | |||
| TAP / Molson Coors Beverage Company | 0.01 | 0.50 | 0.6484 | 0.6484 | |||||
| TROW / T. Rowe Price Group, Inc. | 0.00 | -24.52 | 0.39 | -20.72 | 0.5067 | -0.1111 | |||
| US21871X1090 / Corebridge Financial, Inc. | 0.01 | 0.39 | 0.5054 | 0.5054 | |||||
| PLD / Prologis, Inc. | 0.00 | -44.23 | 0.38 | -54.80 | 0.4855 | -0.5080 | |||
| CMA / Comerica Incorporated | 0.01 | 0.37 | 0.4781 | 0.4781 | |||||
| CI / The Cigna Group | 0.00 | 0.36 | 0.4682 | 0.4682 | |||||
| NEM / Newmont Corporation | 0.01 | -56.68 | 0.36 | -69.84 | 0.4601 | -1.0159 | |||
| HAL / Halliburton Company | 0.01 | 0.36 | 0.4576 | 0.4576 | |||||
| MRK / Merck & Co., Inc. | 0.00 | -100.00 | 0.00 | -100.00 | -1.4350 |