Basic Stats
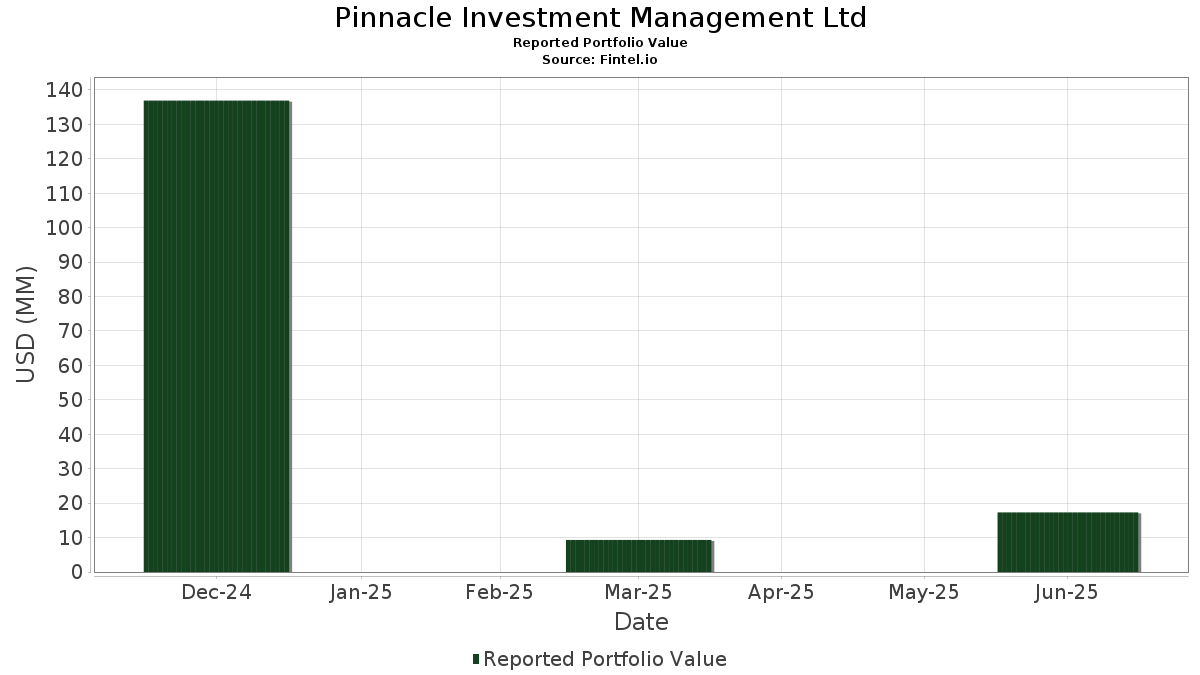
| Portfolio Value | $ 17,311,534 |
| Current Positions | 14 |
Latest Holdings, Performance, AUM (from 13F, 13D)
Pinnacle Investment Management Ltd has disclosed 14 total holdings in their latest SEC filings. Most recent portfolio value is calculated to be $ 17,311,534 USD. Actual Assets Under Management (AUM) is this value plus cash (which is not disclosed). Pinnacle Investment Management Ltd’s top holdings are Alphabet Inc. (US:GOOG) , Meta Platforms, Inc. (US:META) , Uber Technologies, Inc. (US:UBER) , SailPoint, Inc. (US:SAIL) , and e.l.f. Beauty, Inc. (US:ELF) . Pinnacle Investment Management Ltd’s new positions include Uber Technologies, Inc. (US:UBER) , SailPoint, Inc. (US:SAIL) , Invesco QQQ Trust, Series 1 (US:QQQ) , Sweetgreen, Inc. (US:SG) , and International Business Machines Corporation (US:IBM) .
Top Increases This Quarter
We use the change in the portfolio allocation because this is the most meaningful metric. Changes can be due to trades or changes in share prices.
| Security | Shares (MM) |
Value (MM$) |
Portfolio % | ΔPortfolio % |
|---|---|---|---|---|
| 0.05 | 8.42 | 48.6524 | 48.6524 | |
| 0.02 | 1.87 | 10.7789 | 10.7789 | |
| 0.00 | 2.21 | 12.7907 | 9.6979 | |
| 0.07 | 1.60 | 9.2435 | 9.2435 | |
| 0.01 | 1.24 | 7.1883 | 7.1883 | |
| 0.00 | 0.39 | 2.2306 | 2.2306 | |
| 0.02 | 0.30 | 1.7191 | 1.7191 | |
| 0.00 | 0.13 | 0.7663 | 0.7663 | |
| 0.00 | 0.13 | 0.7577 | 0.7577 | |
| 0.00 | 0.08 | 0.4438 | 0.4438 |
Top Decreases This Quarter
We use the change in the portfolio allocation because this is the most meaningful metric. Changes can be due to trades or changes in share prices.
| Security | Shares (MM) |
Value (MM$) |
Portfolio % | ΔPortfolio % |
|---|---|---|---|---|
| 0.00 | 0.40 | 2.2940 | -56.3236 | |
| 0.00 | 0.40 | 2.3272 | -4.6518 | |
| 0.00 | 0.00 | -0.1653 |
13F and Fund Filings
This form was filed on 2025-07-18 for the reporting period 2025-06-30. Click the link icon to see the full transaction history.
Upgrade to unlock premium data and export to Excel ![]() .
.
| Security | Type | Avg Share Price | Shares (MM) |
ΔShares (%) |
ΔShares (%) |
Value ($MM) |
Portfolio (%) |
ΔPortfolio (%) |
|
|---|---|---|---|---|---|---|---|---|---|
| GOOG / Alphabet Inc. | 0.05 | 8.42 | 48.6524 | 48.6524 | |||||
| META / Meta Platforms, Inc. | 0.00 | 500.00 | 2.21 | 668.75 | 12.7907 | 9.6979 | |||
| UBER / Uber Technologies, Inc. | 0.02 | 1.87 | 10.7789 | 10.7789 | |||||
| SAIL / SailPoint, Inc. | 0.07 | 1.60 | 9.2435 | 9.2435 | |||||
| ELF / e.l.f. Beauty, Inc. | 0.01 | 1.24 | 7.1883 | 7.1883 | |||||
| NVDA / NVIDIA Corporation | 0.00 | -57.50 | 0.40 | -38.15 | 2.3272 | -4.6518 | |||
| TLT / iShares Trust - iShares 20+ Year Treasury Bond ETF | 0.00 | -92.50 | 0.40 | -92.73 | 2.2940 | -56.3236 | |||
| QQQ / Invesco QQQ Trust, Series 1 | 0.00 | 0.39 | 2.2306 | 2.2306 | |||||
| SG / Sweetgreen, Inc. | 0.02 | 0.30 | 1.7191 | 1.7191 | |||||
| IBM / International Business Machines Corporation | 0.00 | 0.13 | 0.7663 | 0.7663 | |||||
| ORCL / Oracle Corporation | 0.00 | 0.13 | 0.7577 | 0.7577 | |||||
| INOD / Innodata Inc. | 0.00 | 0.08 | 0.4438 | 0.4438 | |||||
| TEM / Tempus AI, Inc. | 0.00 | 0.08 | 0.4404 | 0.4404 | |||||
| TSLA / Tesla, Inc. | 0.00 | 0.06 | 0.3670 | 0.3670 | |||||
| AMZN / Amazon.com, Inc. | 0.00 | -100.00 | 0.00 | 0.0000 | |||||
| TCOM / Trip.com Group Limited - Depositary Receipt (Common Stock) | 0.00 | -100.00 | 0.00 | 0.0000 | |||||
| STAA / STAAR Surgical Company | 0.00 | -100.00 | 0.00 | 0.0000 | |||||
| IONQ / IonQ, Inc. | 0.00 | -100.00 | 0.00 | -100.00 | -0.1653 |