Basic Stats
| Portfolio Value | $ 378,361,000 |
| Current Positions | 81 |
Latest Holdings, Performance, AUM (from 13F, 13D)
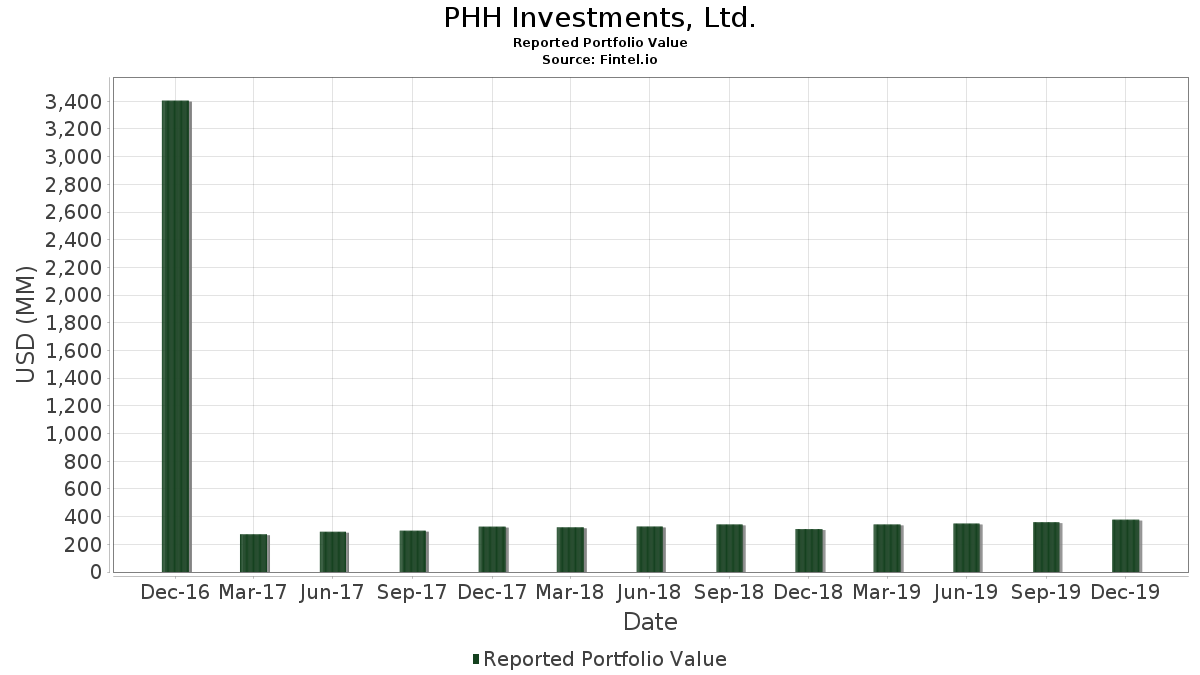
PHH Investments, Ltd. has disclosed 81 total holdings in their latest SEC filings. Most recent portfolio value is calculated to be $ 378,361,000 USD. Actual Assets Under Management (AUM) is this value plus cash (which is not disclosed). PHH Investments, Ltd.’s top holdings are First Trust Exchange-Traded Fund VIII - First Trust TCW Opportunistic Fixed Income ETF (US:FIXD) , iShares Trust - iShares Core U.S. Aggregate Bond ETF (US:AGG) , iShares Trust - iShares Russell 1000 Growth ETF (US:IWF) , Vanguard Russell 1000 Value (US:) , and iShares Trust - iShares S&P 500 Growth ETF (US:IVW) . PHH Investments, Ltd.’s new positions include The Charles Schwab Corporation (US:SCHW) , L3Harris Technologies, Inc. (US:LHX) , Arista Networks Inc (US:ANET) , Sprott Physical Gold and Silver Trust (US:CEF) , and .
Top Increases This Quarter
We use the change in the portfolio allocation because this is the most meaningful metric. Changes can be due to trades or changes in share prices.
| Security | Shares (MM) |
Value (MM$) |
Portfolio % | ΔPortfolio % |
|---|---|---|---|---|
| 0.19 | 32.79 | 8.6674 | 0.6252 | |
| 0.26 | 31.39 | 8.2966 | 0.4741 | |
| 0.32 | 22.22 | 5.8719 | 0.3448 | |
| 0.02 | 1.17 | 0.3092 | 0.3092 | |
| 0.03 | 1.06 | 0.2791 | 0.2791 | |
| 0.01 | 1.05 | 0.2765 | 0.2765 | |
| 0.01 | 1.04 | 0.2759 | 0.2759 | |
| 0.01 | 1.00 | 0.2646 | 0.2646 | |
| 0.22 | 28.06 | 7.4162 | 0.2411 | |
| 0.00 | 0.61 | 0.1612 | 0.1612 |
Top Decreases This Quarter
We use the change in the portfolio allocation because this is the most meaningful metric. Changes can be due to trades or changes in share prices.
| Security | Shares (MM) |
Value (MM$) |
Portfolio % | ΔPortfolio % |
|---|---|---|---|---|
| 0.05 | 8.65 | 2.2862 | -2,272,926.9708 | |
| 0.02 | 3.37 | 0.8909 | -871,510.8403 | |
| 1.00 | 51.87 | 13.7091 | -0.6872 | |
| 0.39 | 43.81 | 11.5789 | -0.5048 | |
| 0.08 | 8.37 | 2.2111 | -0.3240 | |
| 0.00 | 0.00 | -0.2625 | ||
| 0.00 | 0.00 | -0.1989 | ||
| 0.00 | 0.97 | 0.2566 | -0.1894 | |
| 0.02 | 1.74 | 0.4609 | -0.1281 | |
| 0.01 | 1.82 | 0.4823 | -0.1173 |
13F and Fund Filings
This form was filed on 2020-02-13 for the reporting period 2019-12-31. Click the link icon to see the full transaction history.
Upgrade to unlock premium data and export to Excel ![]() .
.
| Security | Type | Avg Share Price | Shares (MM) |
ΔShares (%) |
ΔShares (%) |
Value ($MM) |
Portfolio (%) |
ΔPortfolio (%) |
|
|---|---|---|---|---|---|---|---|---|---|
| FIXD / First Trust Exchange-Traded Fund VIII - First Trust TCW Opportunistic Fixed Income ETF | 1.00 | 1.68 | 51.87 | 0.07 | 13.7091 | -0.6872 | |||
| AGG / iShares Trust - iShares Core U.S. Aggregate Bond ETF | 0.39 | 1.41 | 43.81 | 0.69 | 11.5789 | -0.5048 | |||
| IWF / iShares Trust - iShares Russell 1000 Growth ETF | 0.19 | 2.77 | 32.79 | 13.25 | 8.6674 | 0.6252 | |||
| / Vanguard Russell 1000 Value | 0.26 | 4.56 | 31.39 | 11.45 | 8.2966 | 0.4741 | |||
| IVW / iShares Trust - iShares S&P 500 Growth ETF | 0.15 | -1.01 | 29.46 | 6.48 | 7.7852 | 0.1021 | |||
| IVE / iShares Trust - iShares S&P 500 Value ETF | 0.22 | -0.53 | 28.06 | 8.61 | 7.4162 | 0.2411 | |||
| EFA / iShares Trust - iShares MSCI EAFE ETF | 0.32 | 4.84 | 22.22 | 11.64 | 5.8719 | 0.3448 | |||
| VEA / Vanguard Tax-Managed Funds - Vanguard FTSE Developed Markets ETF | 0.27 | -2.78 | 12.01 | 4.27 | 3.1732 | -0.0246 | |||
| BSV / Vanguard Bond Index Funds - Vanguard Short-Term Bond ETF | 0.14 | 3.43 | 11.14 | 3.20 | 2.9448 | -0.0535 | |||
| VMGMX / Vanguard Index Funds - Vanguard Mid-Cap Growth Index Fund Admiral | 0.05 | -1.41 | 8.65 | 5.69 | 2.2862 | -2,272,926.9708 | |||
| BOND / PIMCO ETF Trust - PIMCO Active Bond Exchange-Traded Fund | 0.08 | -7.43 | 8.37 | -8.35 | 2.2111 | -0.3240 | |||
| VOE / Vanguard Index Funds - Vanguard Mid-Cap Value ETF | 0.06 | -0.87 | 7.24 | 4.57 | 1.9130 | -0.0094 | |||
| JPEM / J.P. Morgan Exchange-Traded Fund Trust - JPMorgan Diversified Return Emerging Markets Equity ETF | 0.10 | 4.59 | 5.53 | 13.67 | 1.4610 | 0.1104 | |||
| TIP / iShares Trust - iShares TIPS Bond ETF | 0.04 | 6.93 | 4.18 | 7.19 | 1.1040 | 0.0217 | |||
| BIV / Vanguard Bond Index Funds - Vanguard Intermediate-Term Bond ETF | 0.04 | 6.84 | 3.69 | 5.88 | 0.9755 | 0.0074 | |||
| VSIIX / Vanguard Index Funds - Vanguard Small-Cap Value Index Fund Institutional | 0.02 | 0.99 | 3.37 | 7.43 | 0.8909 | -871,510.8403 | |||
| AAPL / Apple Inc. | 0.01 | -2.79 | 3.31 | 27.42 | 0.8756 | 0.1535 | |||
| MSFT / Microsoft Corporation | 0.02 | -1.58 | 2.77 | 11.66 | 0.7316 | 0.0431 | |||
| T / AT&T Inc. | 0.06 | -3.08 | 2.49 | 0.12 | 0.6589 | -0.0326 | |||
| JPM / JPMorgan Chase & Co. | 0.02 | -2.77 | 2.34 | 15.18 | 0.6195 | 0.0543 | |||
| BAC / Bank of America Corporation | 0.07 | -3.90 | 2.31 | 16.05 | 0.6097 | 0.0576 | |||
| JNJ / Johnson & Johnson | 0.01 | -8.41 | 2.09 | 3.27 | 0.5513 | -0.0097 | |||
| DAL / Delta Air Lines, Inc. | 0.03 | 1.66 | 1.96 | 3.22 | 0.5167 | -0.0093 | |||
| IWM / iShares Trust - iShares Russell 2000 ETF | 0.01 | 2.36 | 1.91 | 12.04 | 0.5040 | 0.0313 | |||
| HON / Honeywell International Inc. | 0.01 | 26.97 | 1.87 | 32.84 | 0.4940 | 0.1032 | |||
| UNP / Union Pacific Corporation | 0.01 | -1.75 | 1.84 | 9.64 | 0.4868 | 0.0203 | |||
| BA / The Boeing Company | 0.01 | -1.27 | 1.82 | -15.47 | 0.4823 | -0.1173 | |||
| NEE / NextEra Energy, Inc. | 0.01 | -2.30 | 1.80 | 1.52 | 0.4757 | -0.0167 | |||
| CVS / CVS Health Corporation | 0.02 | -30.19 | 1.74 | -17.77 | 0.4609 | -0.1281 | |||
| WFC / Wells Fargo & Company | 0.03 | -2.45 | 1.70 | 4.04 | 0.4493 | -0.0045 | |||
| MDT / Medtronic plc | 0.01 | -2.49 | 1.67 | 1.83 | 0.4401 | -0.0140 | |||
| VWO / Vanguard International Equity Index Funds - Vanguard FTSE Emerging Markets ETF | 0.03 | -3.47 | 1.53 | 6.62 | 0.4046 | 0.0058 | |||
| CVX / Chevron Corporation | 0.01 | -2.85 | 1.51 | -1.30 | 0.4004 | -0.0259 | |||
| DIS / The Walt Disney Company | 0.01 | -2.49 | 1.42 | 8.24 | 0.3750 | 0.0109 | |||
| BDX / Becton, Dickinson and Company | 0.01 | -2.51 | 1.42 | 4.81 | 0.3740 | -0.0010 | |||
| ABT / Abbott Laboratories | 0.02 | -1.79 | 1.41 | 1.96 | 0.3713 | -0.0114 | |||
| HD / The Home Depot, Inc. | 0.01 | -2.33 | 1.39 | -8.06 | 0.3679 | -0.0526 | |||
| CMS / CMS Energy Corporation | 0.02 | -3.68 | 1.29 | -5.29 | 0.3407 | -0.0373 | |||
| MSI / Motorola Solutions, Inc. | 0.01 | 1.77 | 1.28 | -3.75 | 0.3388 | -0.0311 | |||
| GOOGL / Alphabet Inc. | 0.00 | -2.21 | 1.24 | 7.24 | 0.3288 | 0.0066 | |||
| WEC / WEC Energy Group, Inc. | 0.01 | -2.72 | 1.22 | -5.64 | 0.3230 | -0.0367 | |||
| UNH / UnitedHealth Group Incorporated | 0.00 | -3.25 | 1.18 | 30.86 | 0.3127 | 0.0616 | |||
| SCHW / The Charles Schwab Corporation | 0.02 | 1.17 | 0.3092 | 0.3092 | |||||
| PEP / PepsiCo, Inc. | 0.01 | -2.88 | 1.14 | -3.15 | 0.3002 | -0.0255 | |||
| AAL / American Airlines Group Inc. | 0.04 | 0.05 | 1.07 | 6.46 | 0.2831 | 0.0037 | |||
| DTE / DTE Energy Company | 0.01 | -2.60 | 1.07 | -4.81 | 0.2825 | -0.0294 | |||
| STOR / Store Capital Corp | 0.03 | -2.50 | 1.06 | -2.94 | 0.2791 | 0.2791 | |||
| EFX / Equifax Inc. | 0.01 | -1.85 | 1.05 | -2.22 | 0.2788 | -0.0208 | |||
| GIS / General Mills, Inc. | 0.02 | -3.83 | 1.05 | -6.55 | 0.2788 | -0.0347 | |||
| NOC / Northrop Grumman Corporation | 0.00 | -2.77 | 1.05 | -10.78 | 0.2778 | -0.0494 | |||
| AAP / Advance Auto Parts, Inc. | 0.01 | -2.58 | 1.05 | -5.68 | 0.2765 | 0.2765 | |||
| AIZ / Assurant, Inc. | 0.01 | -0.43 | 1.04 | 3.78 | 0.2759 | 0.2759 | |||
| MDYV / SPDR Series Trust - SPDR S&P 400 Mid Cap Value ETF | 0.02 | -2.55 | 1.03 | 4.02 | 0.2733 | -0.0028 | |||
| CB / Chubb Limited | 0.01 | -2.53 | 1.03 | -6.02 | 0.2725 | -0.0322 | |||
| HRL / Hormel Foods Corporation | 0.02 | -4.34 | 1.02 | -1.35 | 0.2701 | -0.0176 | |||
| LHX / L3Harris Technologies, Inc. | 0.01 | 1.00 | 0.2646 | 0.2646 | |||||
| CL / Colgate-Palmolive Company | 0.01 | -3.36 | 1.00 | -9.49 | 0.2646 | -0.0426 | |||
| NFLX / Netflix, Inc. | 0.00 | -50.00 | 0.97 | -39.54 | 0.2566 | -0.1894 | |||
| AIG / American International Group, Inc. | 0.02 | -2.02 | 0.96 | -9.77 | 0.2540 | -0.0418 | |||
| USB / U.S. Bancorp | 0.02 | -3.78 | 0.94 | 3.07 | 0.2487 | -0.0049 | |||
| PSA / Public Storage | 0.00 | -2.91 | 0.88 | -15.71 | 0.2326 | -0.0574 | |||
| EOG / EOG Resources, Inc. | 0.01 | -3.35 | 0.88 | 8.97 | 0.2313 | 0.0082 | |||
| COP / ConocoPhillips | 0.01 | -3.61 | 0.85 | 10.08 | 0.2252 | 0.0102 | |||
| SIRI / Sirius XM Holdings Inc. | 0.11 | 0.19 | 0.76 | 14.50 | 0.2003 | 0.0165 | |||
| ANET / Arista Networks Inc | 0.00 | 0.61 | 0.1612 | 0.1612 | |||||
| CCI / Crown Castle Inc. | 0.00 | -2.48 | 0.59 | -0.34 | 0.1562 | -0.0085 | |||
| SPY / SPDR S&P 500 ETF | 0.00 | 6.39 | 0.58 | 15.19 | 0.1543 | 0.0135 | |||
| MRVL / Marvell Technology, Inc. | 0.02 | 4.42 | 0.55 | 10.89 | 0.1454 | 0.1454 | |||
| CACI / CACI International Inc | 0.00 | 6.98 | 0.52 | 15.66 | 0.1366 | 0.1366 | |||
| IJS / iShares Trust - iShares S&P Small-Cap 600 Value ETF | 0.00 | -4.44 | 0.47 | 2.16 | 0.1253 | -0.0036 | |||
| GLPI / Gaming and Leisure Properties, Inc. | 0.01 | 0.00 | 0.42 | 12.50 | 0.1118 | 0.0074 | |||
| ATVI / Activision Blizzard Inc | 0.01 | 3.31 | 0.41 | 15.97 | 0.1094 | 0.0103 | |||
| META / Meta Platforms, Inc. | 0.00 | 0.00 | 0.31 | 15.44 | 0.0830 | 0.0074 | |||
| CMCSA / Comcast Corporation | 0.01 | 0.30 | 0.30 | 0.33 | 0.0803 | -0.0038 | |||
| BX / Blackstone Inc. | 0.01 | 0.92 | 0.29 | 15.54 | 0.0766 | 0.0766 | |||
| GPN / Global Payments Inc. | 0.00 | 0.00 | 0.26 | 14.86 | 0.0674 | 0.0674 | |||
| TXN / Texas Instruments Incorporated | 0.00 | 0.26 | 0.25 | -0.40 | 0.0658 | -0.0036 | |||
| MCD / McDonald's Corporation | 0.00 | 0.78 | 0.20 | -7.27 | 0.0539 | -0.0072 | |||
| CEF / Sprott Physical Gold and Silver Trust | 0.01 | 0.17 | 0.0444 | 0.0444 | |||||
| EKSO / Ekso Bionics Holdings, Inc. | 0.07 | 25.53 | 0.03 | -6.45 | 0.0077 | -0.0009 | |||
| UAMY / United States Antimony Corporation | 0.06 | 0.00 | 0.02 | -32.35 | 0.0061 | -0.0034 | |||
| DUK / Duke Energy Corporation | 0.00 | -100.00 | 0.00 | -100.00 | -0.0822 | ||||
| WAL / Western Alliance Bancorporation | 0.00 | -100.00 | 0.00 | -100.00 | -0.1989 | ||||
| XOM / Exxon Mobil Corporation | 0.00 | -100.00 | 0.00 | -100.00 | -0.0844 | ||||
| GD / General Dynamics Corporation | 0.00 | -100.00 | 0.00 | -100.00 | -0.2625 |