Basic Stats
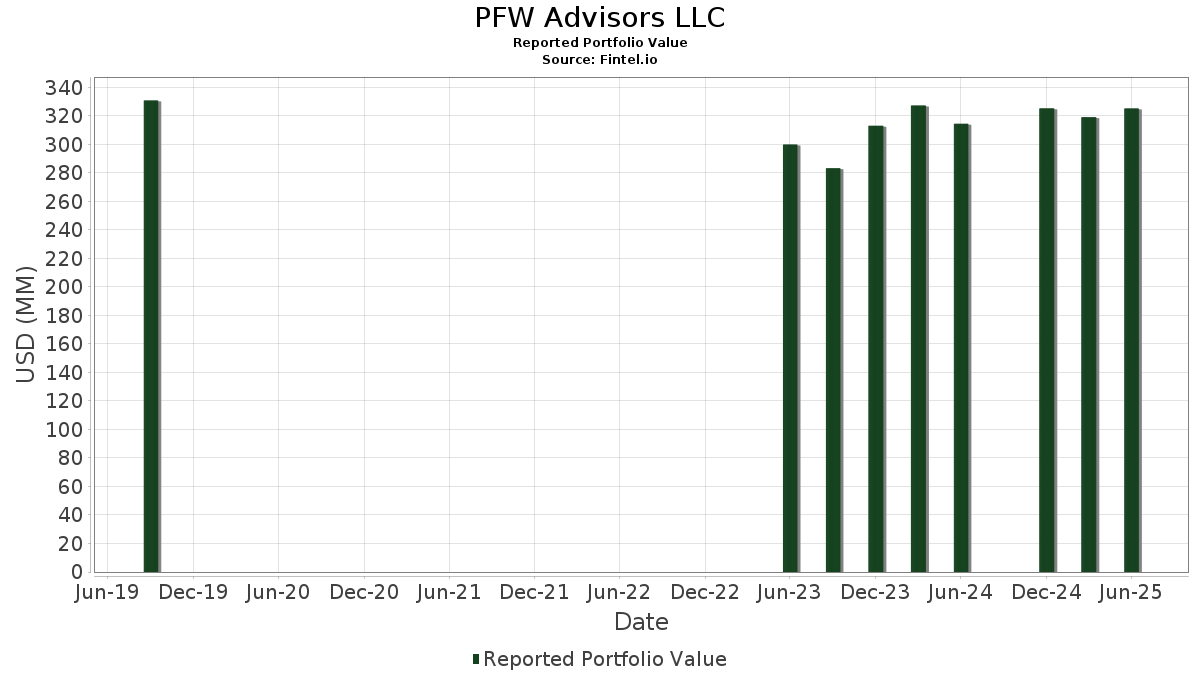
| Portfolio Value | $ 325,065,616 |
| Current Positions | 125 |
Latest Holdings, Performance, AUM (from 13F, 13D)
PFW Advisors LLC has disclosed 125 total holdings in their latest SEC filings. Most recent portfolio value is calculated to be $ 325,065,616 USD. Actual Assets Under Management (AUM) is this value plus cash (which is not disclosed). PFW Advisors LLC’s top holdings are The Coca-Cola Company (US:KO) , Vulcan Materials Company (US:VMC) , iShares Trust - iShares Russell 1000 Growth ETF (US:IWF) , iShares Trust - iShares Russell 1000 Value ETF (US:IWD) , and iShares Trust - iShares Russell Mid-Cap ETF (US:IWR) . PFW Advisors LLC’s new positions include J.P. Morgan Exchange-Traded Fund Trust - JPMorgan Ultra-Short Municipal Income ETF (US:JMST) , CrowdStrike Holdings, Inc. (US:CRWD) , International Business Machines Corporation (US:IBM) , Tenet Healthcare Corporation (US:THC) , and NuScale Power Corporation (US:SMR) .
Top Increases This Quarter
We use the change in the portfolio allocation because this is the most meaningful metric. Changes can be due to trades or changes in share prices.
| Security | Shares (MM) |
Value (MM$) |
Portfolio % | ΔPortfolio % |
|---|---|---|---|---|
| 0.07 | 28.32 | 8.7132 | 0.8894 | |
| 0.12 | 31.35 | 9.6436 | 0.8524 | |
| 0.02 | 3.86 | 1.1870 | 0.3237 | |
| 0.01 | 4.33 | 1.3319 | 0.1738 | |
| 0.18 | 16.83 | 5.1787 | 0.1486 | |
| 0.01 | 0.41 | 0.1261 | 0.1261 | |
| 0.02 | 2.69 | 0.8287 | 0.1065 | |
| 0.00 | 1.44 | 0.4434 | 0.1008 | |
| 0.15 | 8.79 | 2.7047 | 0.0937 | |
| 0.03 | 3.22 | 0.9899 | 0.0931 |
Top Decreases This Quarter
We use the change in the portfolio allocation because this is the most meaningful metric. Changes can be due to trades or changes in share prices.
| Security | Shares (MM) |
Value (MM$) |
Portfolio % | ΔPortfolio % |
|---|---|---|---|---|
| 0.46 | 32.26 | 9.9228 | -0.5322 | |
| 0.02 | 4.68 | 1.4386 | -0.2955 | |
| 0.00 | 0.72 | 0.2221 | -0.2609 | |
| 0.01 | 2.45 | 0.7547 | -0.1694 | |
| 0.02 | 1.69 | 0.5189 | -0.1504 | |
| 0.11 | 22.17 | 6.8191 | -0.1460 | |
| 0.01 | 0.59 | 0.1802 | -0.1421 | |
| 0.02 | 0.42 | 0.1306 | -0.1319 | |
| 0.00 | 0.97 | 0.2980 | -0.1283 | |
| 0.04 | 3.68 | 1.1325 | -0.1070 |
13F and Fund Filings
This form was filed on 2025-07-09 for the reporting period 2025-06-30. Click the link icon to see the full transaction history.
Upgrade to unlock premium data and export to Excel ![]() .
.
| Security | Type | Avg Share Price | Shares (MM) |
ΔShares (%) |
ΔShares (%) |
Value ($MM) |
Portfolio (%) |
ΔPortfolio (%) |
|
|---|---|---|---|---|---|---|---|---|---|
| KO / The Coca-Cola Company | 0.46 | -2.08 | 32.26 | -3.27 | 9.9228 | -0.5322 | |||
| VMC / Vulcan Materials Company | 0.12 | 0.00 | 31.35 | 11.79 | 9.6436 | 0.8524 | |||
| IWF / iShares Trust - iShares Russell 1000 Growth ETF | 0.07 | -3.47 | 28.32 | 13.50 | 8.7132 | 0.8894 | |||
| IWD / iShares Trust - iShares Russell 1000 Value ETF | 0.11 | -3.34 | 22.17 | -0.22 | 6.8191 | -0.1460 | |||
| IWR / iShares Trust - iShares Russell Mid-Cap ETF | 0.18 | -2.95 | 16.83 | 4.93 | 5.1787 | 0.1486 | |||
| VWO / Vanguard International Equity Index Funds - Vanguard FTSE Emerging Markets ETF | 0.19 | -5.17 | 9.55 | 3.63 | 2.9388 | 0.0485 | |||
| VEA / Vanguard Tax-Managed Funds - Vanguard FTSE Developed Markets ETF | 0.15 | -5.87 | 8.79 | 5.57 | 2.7047 | 0.0937 | |||
| EEM / iShares, Inc. - iShares MSCI Emerging Markets ETF | 0.14 | -9.03 | 6.91 | 0.42 | 2.1256 | -0.0317 | |||
| AGG / iShares Trust - iShares Core U.S. Aggregate Bond ETF | 0.06 | -1.14 | 6.39 | -0.87 | 1.9668 | -0.0551 | |||
| BLV / Vanguard Bond Index Funds - Vanguard Long-Term Bond ETF | 0.09 | -1.03 | 6.36 | -2.27 | 1.9577 | -0.0838 | |||
| IWM / iShares Trust - iShares Russell 2000 ETF | 0.03 | -3.73 | 6.32 | 4.13 | 1.9452 | 0.0415 | |||
| MINT / PIMCO ETF Trust - PIMCO Enhanced Short Maturity Active Exchange-Traded Fund | 0.06 | 6.58 | 6.18 | 6.48 | 1.9014 | 0.0816 | |||
| BND / Vanguard Bond Index Funds - Vanguard Total Bond Market ETF | 0.08 | -1.29 | 6.00 | -1.04 | 1.8463 | -0.0552 | |||
| IUSB / iShares Trust - iShares Core Total USD Bond Market ETF | 0.13 | -1.16 | 5.95 | -0.83 | 1.8298 | -0.0508 | |||
| AAPL / Apple Inc. | 0.02 | -8.46 | 4.68 | -15.44 | 1.4386 | -0.2955 | |||
| PHYL / PGIM ETF Trust - PGIM Active High Yield Bond ETF | 0.13 | -0.44 | 4.66 | 1.48 | 1.4328 | -0.0062 | |||
| MSFT / Microsoft Corporation | 0.01 | -11.54 | 4.33 | 17.22 | 1.3319 | 0.1738 | |||
| NVDD / Direxion Shares ETF Trust - Direxion Daily NVDA Bear 1X Shares | 0.02 | -3.87 | 3.86 | 40.14 | 1.1870 | 0.3237 | |||
| EFA / iShares Trust - iShares MSCI EAFE ETF | 0.04 | -14.86 | 3.68 | -6.88 | 1.1325 | -0.1070 | |||
| ACWI / iShares Trust - iShares MSCI ACWI ETF | 0.03 | 1.82 | 3.22 | 12.48 | 0.9899 | 0.0931 | |||
| V / Visa Inc. | 0.01 | -2.35 | 3.03 | -1.08 | 0.9320 | -0.0281 | |||
| ICE / Intercontinental Exchange, Inc. | 0.02 | -4.77 | 2.91 | 1.29 | 0.8937 | -0.0055 | |||
| ABT / Abbott Laboratories | 0.02 | -2.46 | 2.71 | 0.00 | 0.8348 | -0.0159 | |||
| EMR / Emerson Electric Co. | 0.02 | -3.83 | 2.69 | 16.93 | 0.8287 | 0.1065 | |||
| CSCO / Cisco Systems, Inc. | 0.04 | -3.05 | 2.68 | 9.04 | 0.8242 | 0.0536 | |||
| VO / Vanguard Index Funds - Vanguard Mid-Cap ETF | 0.01 | -7.11 | 2.64 | 0.53 | 0.8135 | -0.0114 | |||
| BLK / BlackRock, Inc. | 0.00 | -4.09 | 2.53 | 6.29 | 0.7795 | 0.0323 | |||
| HD / The Home Depot, Inc. | 0.01 | -16.80 | 2.45 | -16.76 | 0.7547 | -0.1694 | |||
| PG / The Procter & Gamble Company | 0.02 | -3.00 | 2.41 | -9.32 | 0.7425 | -0.0919 | |||
| PAYX / Paychex, Inc. | 0.02 | -2.58 | 2.41 | -8.15 | 0.7424 | -0.0813 | |||
| MCD / McDonald's Corporation | 0.01 | -3.44 | 2.40 | -9.69 | 0.7396 | -0.0950 | |||
| ITW / Illinois Tool Works Inc. | 0.01 | -3.43 | 2.29 | -3.70 | 0.7039 | -0.0413 | |||
| ACN / Accenture plc | 0.01 | -7.41 | 2.27 | -11.34 | 0.6977 | -0.1040 | |||
| NEE / NextEra Energy, Inc. | 0.03 | -2.61 | 2.25 | -4.61 | 0.6936 | -0.0476 | |||
| PSX / Phillips 66 | 0.02 | -2.24 | 2.21 | -5.55 | 0.6810 | -0.0538 | |||
| MDLZ / Mondelez International, Inc. | 0.03 | -2.47 | 2.21 | -3.08 | 0.6786 | -0.0349 | |||
| JNJ / Johnson & Johnson | 0.01 | -4.39 | 2.13 | -11.92 | 0.6547 | -0.1029 | |||
| COST / Costco Wholesale Corporation | 0.00 | -5.49 | 2.05 | -1.06 | 0.6292 | -0.0190 | |||
| AWK / American Water Works Company, Inc. | 0.01 | -2.62 | 1.96 | -8.16 | 0.6024 | -0.0661 | |||
| SBUX / Starbucks Corporation | 0.02 | -3.78 | 1.94 | -10.09 | 0.5978 | -0.0800 | |||
| CMCSA / Comcast Corporation | 0.05 | -1.43 | 1.90 | -4.66 | 0.5857 | -0.0404 | |||
| ZTS / Zoetis Inc. | 0.01 | -2.60 | 1.71 | -7.73 | 0.5255 | -0.0550 | |||
| VTWO / Vanguard Scottsdale Funds - Vanguard Russell 2000 ETF | 0.02 | -26.94 | 1.69 | -20.99 | 0.5189 | -0.1504 | |||
| LIN / Linde plc | 0.00 | -3.53 | 1.60 | -2.79 | 0.4932 | -0.0239 | |||
| WMT / Walmart Inc. | 0.02 | -6.04 | 1.58 | 4.65 | 0.4846 | 0.0127 | |||
| AMZN / Amazon.com, Inc. | 0.01 | 4.61 | 1.50 | 20.64 | 0.4623 | 0.0717 | |||
| VBIL / Vanguard Institutional Index Fund - 0-3 Months Treasury Bill ETF | 0.02 | -17.29 | 1.49 | -17.18 | 0.4599 | -0.1060 | |||
| META / Meta Platforms, Inc. | 0.00 | 3.01 | 1.44 | 31.96 | 0.4434 | 0.1008 | |||
| ECL / Ecolab Inc. | 0.01 | -2.14 | 1.42 | 3.96 | 0.4365 | 0.0088 | |||
| JPM / JPMorgan Chase & Co. | 0.00 | -2.80 | 1.42 | 14.92 | 0.4359 | 0.0492 | |||
| SYK / Stryker Corporation | 0.00 | -8.52 | 1.36 | -2.79 | 0.4183 | -0.0202 | |||
| ADI / Analog Devices, Inc. | 0.01 | -2.31 | 1.31 | 15.33 | 0.4027 | 0.0468 | |||
| CBSH / Commerce Bancshares, Inc. | 0.02 | -2.26 | 1.29 | -2.34 | 0.3972 | -0.0174 | |||
| VONE / Vanguard Scottsdale Funds - Vanguard Russell 1000 ETF | 0.00 | -15.87 | 1.29 | -6.93 | 0.3971 | -0.0377 | |||
| GOOG / Alphabet Inc. | 0.01 | 2.48 | 1.19 | 16.73 | 0.3672 | 0.0468 | |||
| WEC / WEC Energy Group, Inc. | 0.01 | -4.01 | 1.14 | -8.21 | 0.3511 | -0.0387 | |||
| GD / General Dynamics Corporation | 0.00 | -4.12 | 1.11 | 2.60 | 0.3401 | 0.0022 | |||
| AVGO / Broadcom Inc. | 0.00 | -28.63 | 1.09 | 17.56 | 0.3356 | 0.0445 | |||
| NKE / NIKE, Inc. | 0.01 | 12.96 | 1.05 | 26.48 | 0.3220 | 0.0624 | |||
| AON / Aon plc | 0.00 | -0.21 | 1.03 | -10.77 | 0.3160 | -0.0450 | |||
| TSCO / Tractor Supply Company | 0.02 | -9.65 | 1.00 | -13.45 | 0.3089 | -0.0549 | |||
| APD / Air Products and Chemicals, Inc. | 0.00 | -2.43 | 1.00 | -6.65 | 0.3068 | -0.0283 | |||
| LHX / L3Harris Technologies, Inc. | 0.00 | -11.40 | 0.99 | 6.14 | 0.3036 | 0.0122 | |||
| BAC / Bank of America Corporation | 0.02 | 0.01 | 0.98 | 13.49 | 0.3028 | 0.0307 | |||
| AMGN / Amgen Inc. | 0.00 | -20.51 | 0.97 | -28.77 | 0.2980 | -0.1283 | |||
| HON / Honeywell International Inc. | 0.00 | -3.94 | 0.91 | 5.66 | 0.2814 | 0.0099 | |||
| PH / Parker-Hannifin Corporation | 0.00 | -2.25 | 0.91 | 12.33 | 0.2804 | 0.0260 | |||
| WFC / Wells Fargo & Company | 0.01 | 0.35 | 0.89 | 12.14 | 0.2729 | 0.0246 | |||
| PLD / Prologis, Inc. | 0.01 | -5.54 | 0.83 | -11.18 | 0.2567 | -0.0378 | |||
| MKC / McCormick & Company, Incorporated | 0.01 | -3.62 | 0.80 | -11.27 | 0.2473 | -0.0366 | |||
| PPG / PPG Industries, Inc. | 0.01 | -11.59 | 0.77 | -8.04 | 0.2359 | -0.0255 | |||
| O / Realty Income Corporation | 0.01 | -2.58 | 0.76 | -3.30 | 0.2347 | -0.0125 | |||
| GOOG / Alphabet Inc. | 0.00 | -3.87 | 0.74 | 9.14 | 0.2279 | 0.0151 | |||
| TSLA / Tesla, Inc. | 0.00 | -16.40 | 0.73 | 2.37 | 0.2257 | 0.0012 | |||
| UNH / UnitedHealth Group Incorporated | 0.00 | -21.32 | 0.72 | -53.18 | 0.2221 | -0.2609 | |||
| SHM / SPDR Series Trust - SPDR Nuveen ICE Short Term Municipal Bond ETF | 0.01 | -30.71 | 0.71 | -30.40 | 0.2171 | -0.1007 | |||
| EME / EMCOR Group, Inc. | 0.00 | 0.00 | 0.67 | 44.83 | 0.2068 | 0.0612 | |||
| UNP / Union Pacific Corporation | 0.00 | -14.99 | 0.67 | -17.28 | 0.2063 | -0.0476 | |||
| HYD / VanEck ETF Trust - VanEck High Yield Muni ETF | 0.01 | -1.83 | 0.66 | -3.64 | 0.2034 | -0.0118 | |||
| LLY / Eli Lilly and Company | 0.00 | -1.17 | 0.66 | -6.80 | 0.2026 | -0.0188 | |||
| BRK.B / Berkshire Hathaway Inc. | 0.00 | -4.77 | 0.65 | -13.24 | 0.1999 | -0.0347 | |||
| VB / Vanguard Index Funds - Vanguard Small-Cap ETF | 0.00 | 0.00 | 0.59 | 6.87 | 0.1818 | 0.0084 | |||
| VTEB / Vanguard Municipal Bond Funds - Vanguard Tax-Exempt Bond ETF | 0.01 | -42.32 | 0.59 | -43.04 | 0.1802 | -0.1421 | |||
| SO / The Southern Company | 0.01 | 1.41 | 0.57 | 1.25 | 0.1752 | -0.0011 | |||
| MA / Mastercard Incorporated | 0.00 | -1.23 | 0.54 | 1.32 | 0.1660 | -0.0011 | |||
| NFLX / Netflix, Inc. | 0.00 | 1.06 | 0.51 | 45.30 | 0.1570 | 0.0467 | |||
| TFI / SPDR Series Trust - SPDR Nuveen ICE Municipal Bond ETF | 0.01 | -6.09 | 0.51 | -6.99 | 0.1559 | -0.0148 | |||
| RBC / RBC Bearings Incorporated | 0.00 | 0.00 | 0.48 | 19.70 | 0.1479 | 0.0219 | |||
| SSD / Simpson Manufacturing Co., Inc. | 0.00 | 0.00 | 0.46 | -1.29 | 0.1418 | -0.0044 | |||
| TEVA / Teva Pharmaceutical Industries Limited - Depositary Receipt (Common Stock) | 0.03 | 1.20 | 0.44 | 10.28 | 0.1356 | 0.0104 | |||
| SNV / Synovus Financial Corp. | 0.01 | -0.77 | 0.44 | 9.77 | 0.1349 | 0.0098 | |||
| PZA / Invesco Exchange-Traded Fund Trust II - Invesco National AMT-Free Municipal Bond ETF | 0.02 | -47.81 | 0.42 | -49.34 | 0.1306 | -0.1319 | |||
| PRI / Primerica, Inc. | 0.00 | 0.00 | 0.42 | -3.70 | 0.1281 | -0.0076 | |||
| JMST / J.P. Morgan Exchange-Traded Fund Trust - JPMorgan Ultra-Short Municipal Income ETF | 0.01 | 0.41 | 0.1261 | 0.1261 | |||||
| SPY / SPDR S&P 500 ETF | 0.00 | 0.00 | 0.40 | 10.58 | 0.1222 | 0.0095 | |||
| MAR / Marriott International, Inc. | 0.00 | 0.15 | 0.37 | 14.91 | 0.1141 | 0.0129 | |||
| ITOT / iShares Trust - iShares Core S&P Total U.S. Stock Market ETF | 0.00 | 0.00 | 0.36 | 10.64 | 0.1121 | 0.0089 | |||
| GE / General Electric Company | 0.00 | -25.00 | 0.35 | -3.55 | 0.1088 | -0.0062 | |||
| UBER / Uber Technologies, Inc. | 0.00 | 1.54 | 0.35 | 30.11 | 0.1080 | 0.0233 | |||
| MANH / Manhattan Associates, Inc. | 0.00 | 0.06 | 0.34 | 14.43 | 0.1050 | 0.0113 | |||
| VGT / Vanguard World Fund - Vanguard Information Technology ETF | 0.00 | 2.42 | 0.31 | 25.61 | 0.0951 | 0.0177 | |||
| AMD / Advanced Micro Devices, Inc. | 0.00 | -6.41 | 0.30 | 29.06 | 0.0931 | 0.0197 | |||
| WTS / Watts Water Technologies, Inc. | 0.00 | 0.00 | 0.28 | 20.60 | 0.0865 | 0.0134 | |||
| MELI / MercadoLibre, Inc. | 0.00 | -0.94 | 0.27 | 33.01 | 0.0844 | 0.0196 | |||
| GOLF / Acushnet Holdings Corp. | 0.00 | 0.00 | 0.27 | 5.88 | 0.0832 | 0.0033 | |||
| XOM / Exxon Mobil Corporation | 0.00 | -21.58 | 0.26 | -29.01 | 0.0791 | -0.0344 | |||
| GGG / Graco Inc. | 0.00 | 0.00 | 0.25 | 2.86 | 0.0776 | 0.0008 | |||
| HLI / Houlihan Lokey, Inc. | 0.00 | 0.00 | 0.25 | 11.50 | 0.0776 | 0.0066 | |||
| ORLY / O'Reilly Automotive, Inc. | 0.00 | 1,400.00 | 0.25 | -5.66 | 0.0769 | -0.0061 | |||
| SAN / Banco Santander, S.A. - Depositary Receipt (Common Stock) | 0.03 | 0.10 | 0.25 | 24.12 | 0.0761 | 0.0136 | |||
| CRWD / CrowdStrike Holdings, Inc. | 0.00 | 0.24 | 0.0750 | 0.0750 | |||||
| PRIM / Primoris Services Corporation | 0.00 | 0.24 | 0.0749 | 0.0749 | |||||
| VRTX / Vertex Pharmaceuticals Incorporated | 0.00 | -31.96 | 0.24 | -37.63 | 0.0746 | -0.0471 | |||
| FCN / FTI Consulting, Inc. | 0.00 | 0.00 | 0.23 | -1.27 | 0.0717 | -0.0025 | |||
| APP / AppLovin Corporation | 0.00 | -16.77 | 0.23 | 10.19 | 0.0700 | 0.0051 | |||
| IBM / International Business Machines Corporation | 0.00 | 0.22 | 0.0684 | 0.0684 | |||||
| THC / Tenet Healthcare Corporation | 0.00 | 0.22 | 0.0668 | 0.0668 | |||||
| SMR / NuScale Power Corporation | 0.01 | 0.22 | 0.0665 | 0.0665 | |||||
| SPGI / S&P Global Inc. | 0.00 | 0.00 | 0.22 | 3.86 | 0.0662 | 0.0012 | |||
| TFC / Truist Financial Corporation | 0.00 | -5.23 | 0.21 | -0.93 | 0.0655 | -0.0019 | |||
| PM / Philip Morris International Inc. | 0.00 | 0.21 | 0.0653 | 0.0653 | |||||
| EQT / EQT Corporation | 0.00 | 0.21 | 0.0648 | 0.0648 | |||||
| BSX / Boston Scientific Corporation | 0.00 | -16.29 | 0.21 | -11.11 | 0.0642 | -0.0092 | |||
| NOW / ServiceNow, Inc. | 0.00 | 0.20 | 0.0620 | 0.0620 | |||||
| MFG / Mizuho Financial Group, Inc. - Depositary Receipt (Common Stock) | 0.01 | -0.03 | 0.06 | 0.00 | 0.0178 | -0.0002 | |||
| ABBV / AbbVie Inc. | 0.00 | -100.00 | 0.00 | 0.0000 | |||||
| HLN / Haleon plc - Depositary Receipt (Common Stock) | 0.00 | -100.00 | 0.00 | 0.0000 | |||||
| COP / ConocoPhillips | 0.00 | -100.00 | 0.00 | 0.0000 | |||||
| ORCL / Oracle Corporation | 0.00 | -100.00 | 0.00 | 0.0000 | |||||
| NVO / Novo Nordisk A/S - Depositary Receipt (Common Stock) | 0.00 | -100.00 | 0.00 | 0.0000 |