Basic Stats
| Portfolio Value | $ 331,711,318 |
| Current Positions | 53 |
Latest Holdings, Performance, AUM (from 13F, 13D)
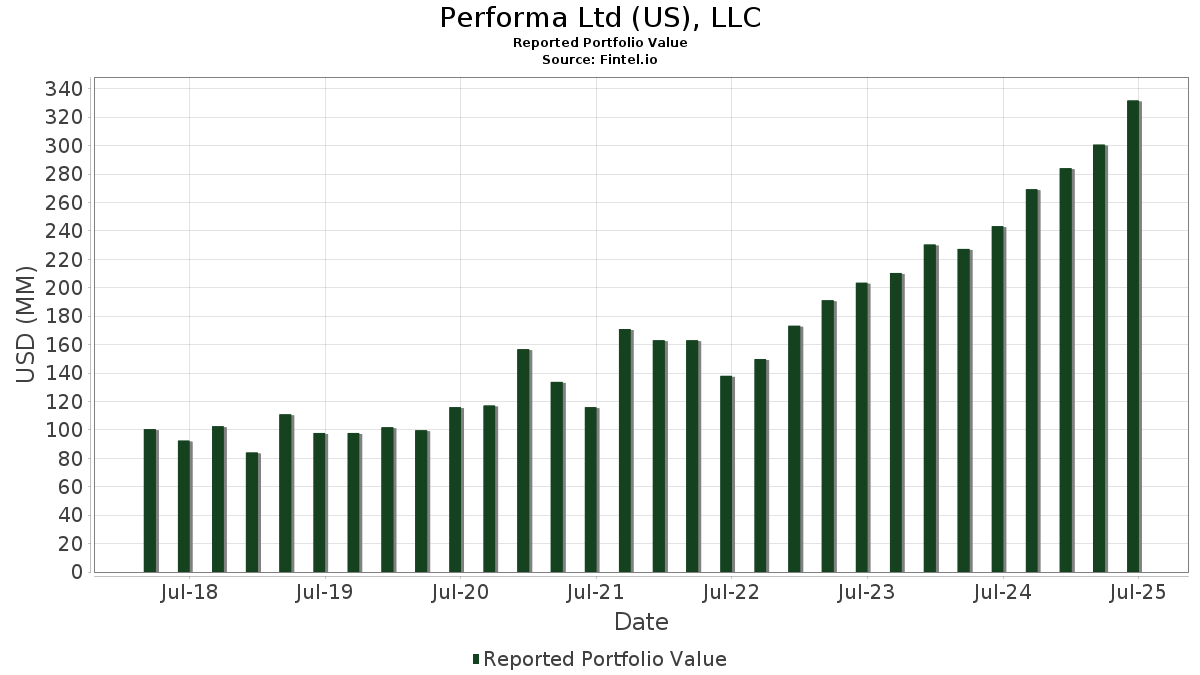
Performa Ltd (US), LLC has disclosed 53 total holdings in their latest SEC filings. Most recent portfolio value is calculated to be $ 331,711,318 USD. Actual Assets Under Management (AUM) is this value plus cash (which is not disclosed). Performa Ltd (US), LLC’s top holdings are Vanguard Index Funds - Vanguard S&P 500 ETF (US:VOO) , SPDR S&P 500 ETF (US:SPY) , DBX ETF Trust - Xtrackers USD High Yield Corporate Bond ETF (US:HYLB) , Vanguard Index Funds - Vanguard Mid-Cap ETF (US:VO) , and Vanguard International Equity Index Funds - Vanguard FTSE All-World ex-US ETF (US:VEU) . Performa Ltd (US), LLC’s new positions include Allbirds, Inc. (US:BIRD) , Paysafe Limited (US:PSFE) , American Airlines Group Inc. (US:AAL) , .
Top Increases This Quarter
We use the change in the portfolio allocation because this is the most meaningful metric. Changes can be due to trades or changes in share prices.
| Security | Shares (MM) |
Value (MM$) |
Portfolio % | ΔPortfolio % |
|---|---|---|---|---|
| 0.16 | 92.60 | 27.9152 | 1.5063 | |
| 0.16 | 44.61 | 13.4496 | 0.9278 | |
| 0.28 | 18.90 | 5.6989 | 0.8587 | |
| 0.08 | 15.08 | 4.5472 | 0.2697 | |
| 0.05 | 8.28 | 2.4968 | 0.1605 | |
| 0.06 | 6.46 | 1.9488 | 0.1292 | |
| 0.11 | 66.94 | 20.1810 | 0.0835 | |
| 1.30 | 47.96 | 14.4576 | 0.0299 | |
| 0.04 | 7.37 | 2.2220 | 0.0297 | |
| 0.10 | 7.32 | 2.2075 | 0.0112 |
Top Decreases This Quarter
We use the change in the portfolio allocation because this is the most meaningful metric. Changes can be due to trades or changes in share prices.
| Security | Shares (MM) |
Value (MM$) |
Portfolio % | ΔPortfolio % |
|---|---|---|---|---|
| 0.11 | 3.26 | 0.9826 | -3.5756 | |
| 0.02 | 0.02 | 0.0062 | -0.0081 | |
| 0.00 | 0.01 | 0.0016 | -0.0050 | |
| 0.00 | 0.00 | 0.0007 | -0.0039 | |
| 0.03 | 7.74 | 2.3345 | -0.0034 | |
| 0.00 | 0.00 | -0.0020 | ||
| 0.00 | 0.01 | 0.0027 | -0.0018 | |
| 0.00 | 0.00 | 0.0011 | -0.0018 | |
| 0.00 | 0.00 | 0.0008 | -0.0012 | |
| 0.00 | 0.00 | 0.0014 | -0.0010 |
13F and Fund Filings
This form was filed on 2025-08-11 for the reporting period 2025-06-30. Click the link icon to see the full transaction history.
Upgrade to unlock premium data and export to Excel ![]() .
.
| Security | Type | Avg Share Price | Shares (MM) |
ΔShares (%) |
ΔShares (%) |
Value ($MM) |
Portfolio (%) |
ΔPortfolio (%) |
|
|---|---|---|---|---|---|---|---|---|---|
| VOO / Vanguard Index Funds - Vanguard S&P 500 ETF | 0.16 | 5.51 | 92.60 | 16.62 | 27.9152 | 1.5063 | |||
| SPY / SPDR S&P 500 ETF | 0.11 | 0.31 | 66.94 | 10.79 | 20.1810 | 0.0835 | |||
| HYLB / DBX ETF Trust - Xtrackers USD High Yield Corporate Bond ETF | 1.30 | 8.25 | 47.96 | 10.56 | 14.4576 | 0.0299 | |||
| VO / Vanguard Index Funds - Vanguard Mid-Cap ETF | 0.16 | 9.52 | 44.61 | 18.50 | 13.4496 | 0.9278 | |||
| VEU / Vanguard International Equity Index Funds - Vanguard FTSE All-World ex-US ETF | 0.28 | 17.23 | 18.90 | 29.91 | 5.6989 | 0.8587 | |||
| VBR / Vanguard Index Funds - Vanguard Small-Cap Value ETF | 0.08 | 12.04 | 15.08 | 17.29 | 4.5472 | 0.2697 | |||
| IWN / iShares Trust - iShares Russell 2000 Value ETF | 0.05 | 12.84 | 8.28 | 17.91 | 2.4968 | 0.1605 | |||
| VBK / Vanguard Index Funds - Vanguard Small-Cap Growth ETF | 0.03 | 0.16 | 7.74 | 10.17 | 2.3345 | -0.0034 | |||
| QUAL / iShares Trust - iShares MSCI USA Quality Factor ETF | 0.04 | 4.51 | 7.37 | 11.82 | 2.2220 | 0.0297 | |||
| SPHQ / Invesco Exchange-Traded Fund Trust - Invesco S&P 500 Quality ETF | 0.10 | 3.22 | 7.32 | 10.89 | 2.2075 | 0.0112 | |||
| IJR / iShares Trust - iShares Core S&P Small-Cap ETF | 0.06 | 13.06 | 6.46 | 18.17 | 1.9488 | 0.1292 | |||
| EWJ / iShares, Inc. - iShares MSCI Japan ETF | 0.06 | 0.83 | 4.26 | 10.25 | 1.2847 | -0.0009 | |||
| ANGL / VanEck ETF Trust - VanEck Fallen Angel High Yield Bond ETF | 0.11 | -76.56 | 3.26 | -76.22 | 0.9826 | -3.5756 | |||
| IWP / iShares Trust - iShares Russell Mid-Cap Growth ETF | 0.00 | 0.07 | 0.20 | 18.24 | 0.0609 | 0.0040 | |||
| BIRD / Allbirds, Inc. | 0.01 | 0.10 | 0.0000 | ||||||
| JELD / JELD-WEN Holding, Inc. | 0.02 | 168.48 | 0.10 | 77.78 | 0.0292 | 0.0109 | |||
| OATLY GROUP AB / (67421J108) | 0.01 | 0.09 | 0.0000 | ||||||
| LESL / Leslie's, Inc. | 0.16 | 249.82 | 0.07 | 100.00 | 0.0206 | 0.0092 | |||
| MRVI / Maravai LifeSciences Holdings, Inc. | 0.02 | 33.28 | 0.06 | 44.74 | 0.0167 | 0.0040 | |||
| OPEN / Opendoor Technologies Inc. | 0.07 | 892.91 | 0.04 | 428.57 | 0.0112 | 0.0088 | |||
| SSTK / Shutterstock, Inc. | 0.00 | 31.93 | 0.03 | 32.00 | 0.0102 | 0.0018 | |||
| XRAY / DENTSPLY SIRONA Inc. | 0.00 | 26.17 | 0.02 | 41.18 | 0.0072 | 0.0013 | |||
| ASAN / Asana, Inc. | 0.00 | 54.91 | 0.02 | 42.86 | 0.0062 | 0.0014 | |||
| PSNY / Polestar Automotive Holding UK PLC - Depositary Receipt (Common Stock) | 0.02 | -53.04 | 0.02 | -53.49 | 0.0062 | -0.0081 | |||
| OLN / Olin Corporation | 0.00 | 79.29 | 0.02 | 54.55 | 0.0052 | 0.0013 | |||
| TLRY / Tilray Brands, Inc. | 0.04 | 825.00 | 0.02 | 650.00 | 0.0046 | 0.0037 | |||
| OATLY GROUP AB / (67421J108) | Call | 0.00 | 0.01 | 0.0000 | |||||
| PATH / UiPath Inc. | 0.00 | -46.15 | 0.01 | -38.46 | 0.0027 | -0.0018 | |||
| XOM / Exxon Mobil Corporation | 0.00 | 0.00 | 0.01 | 0.00 | 0.0024 | -0.0005 | |||
| PSTG / Pure Storage, Inc. | 0.00 | -16.67 | 0.01 | 16.67 | 0.0022 | -0.0000 | |||
| MD / Pediatrix Medical Group, Inc. | 0.00 | 0.00 | 0.01 | 0.00 | 0.0020 | -0.0002 | |||
| F / Ford Motor Company | 0.00 | 0.01 | 0.0018 | 0.0018 | |||||
| RIG / Transocean Ltd. | 0.00 | -9.94 | 0.01 | -25.00 | 0.0018 | -0.0009 | |||
| GTM / ZoomInfo Technologies Inc. | 0.00 | 0.00 | 0.01 | 0.00 | 0.0016 | -0.0001 | |||
| VREX / Varex Imaging Corporation | 0.00 | 51.90 | 0.01 | 25.00 | 0.0016 | 0.0000 | |||
| BZH / Beazer Homes USA, Inc. | 0.00 | -76.29 | 0.01 | -73.68 | 0.0016 | -0.0050 | |||
| TEVA / Teva Pharmaceutical Industries Limited - Depositary Receipt (Common Stock) | 0.00 | 0.01 | 0.0015 | 0.0015 | |||||
| SONO / Sonos, Inc. | 0.00 | 0.00 | 0.00 | 0.00 | 0.0015 | -0.0001 | |||
| U / Unity Software Inc. | 0.00 | -32.79 | 0.00 | -20.00 | 0.0015 | -0.0005 | |||
| SMRT / SmartRent, Inc. | 0.00 | -19.07 | 0.00 | -42.86 | 0.0014 | -0.0010 | |||
| PYPL / PayPal Holdings, Inc. | 0.00 | 37.78 | 0.00 | 100.00 | 0.0014 | 0.0004 | |||
| PSFE / Paysafe Limited | 0.00 | 0.00 | 0.0011 | 0.0011 | |||||
| GETY / Getty Images Holdings, Inc. | 0.00 | -55.00 | 0.00 | -62.50 | 0.0011 | -0.0018 | |||
| SBH / Sally Beauty Holdings, Inc. | 0.00 | 0.00 | 0.00 | 50.00 | 0.0009 | -0.0001 | |||
| JBLU / JetBlue Airways Corporation | 0.00 | 16.67 | 0.00 | 0.00 | 0.0009 | -0.0001 | |||
| CLVT / Clarivate Plc | 0.00 | -59.25 | 0.00 | -66.67 | 0.0008 | -0.0012 | |||
| AAL / American Airlines Group Inc. | 0.00 | -84.62 | 0.00 | -84.62 | 0.0007 | -0.0039 | |||
| LUMN / Lumen Technologies, Inc. | 0.00 | 0.00 | 0.00 | 100.00 | 0.0007 | 0.0000 | |||
| VTGN / Vistagen Therapeutics, Inc. | 0.00 | 0.00 | 0.00 | 0.00 | 0.0006 | -0.0002 | |||
| ASPN / Aspen Aerogels, Inc. | 0.00 | -58.33 | 0.00 | -66.67 | 0.0004 | -0.0008 | |||
| AAL / American Airlines Group Inc. | Put | 0.00 | 0.00 | 0.0003 | 0.0003 | ||||
| RVP / Retractable Technologies, Inc. | 0.00 | 0.00 | 0.00 | 0.00 | 0.0003 | -0.0001 | |||
| IWR / iShares Trust - iShares Russell Mid-Cap ETF | 0.00 | 0.00 | 0.00 | 0.0000 | -0.0000 | ||||
| BLKB / Blackbaud, Inc. | 0.00 | -100.00 | 0.00 | 0.0000 | |||||
| F / Ford Motor Company | Call | 0.00 | -100.00 | 0.00 | -100.00 | -0.0020 | |||
| EWZ / iShares, Inc. - iShares MSCI Brazil ETF | 0.00 | -100.00 | 0.00 | 0.0000 | |||||
| ADBE / Adobe Inc. | 0.00 | -100.00 | 0.00 | 0.0000 | |||||
| WBA / Walgreens Boots Alliance, Inc. | Call | 0.00 | -100.00 | 0.00 | 0.0000 |