Basic Stats
| Portfolio Value | $ 189,417,320 |
| Current Positions | 45 |
Latest Holdings, Performance, AUM (from 13F, 13D)
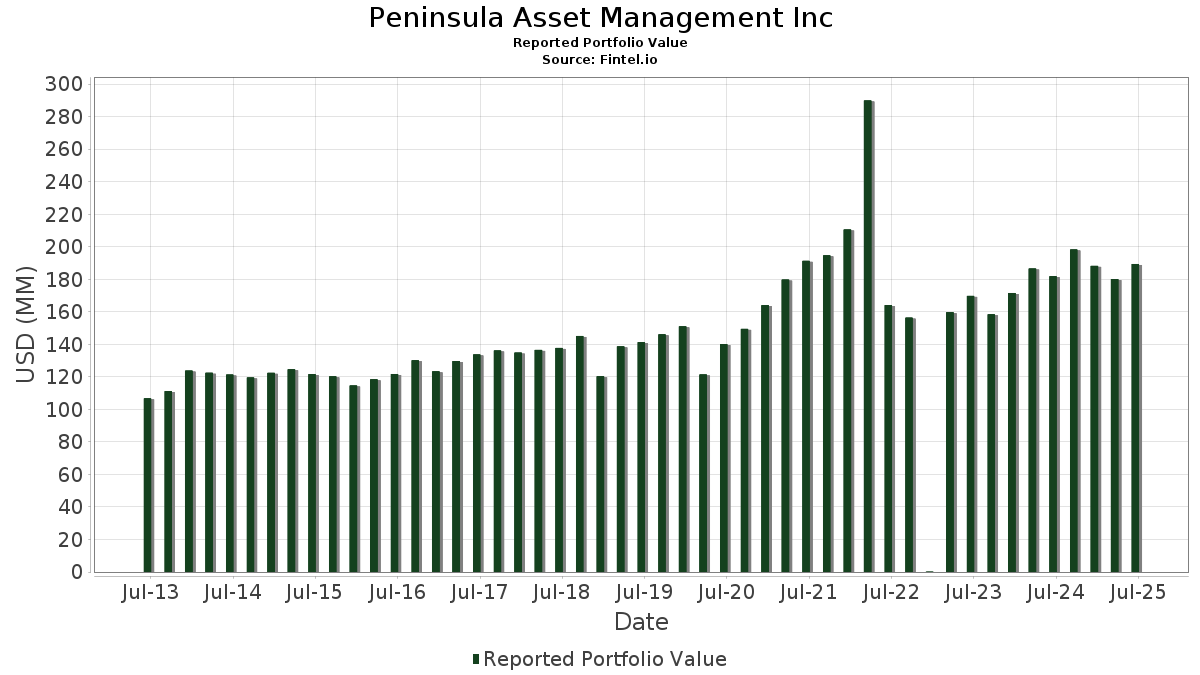
Peninsula Asset Management Inc has disclosed 45 total holdings in their latest SEC filings. Most recent portfolio value is calculated to be $ 189,417,320 USD. Actual Assets Under Management (AUM) is this value plus cash (which is not disclosed). Peninsula Asset Management Inc’s top holdings are iShares Trust - iShares Core S&P Mid-Cap ETF (US:IJH) , iShares Trust - iShares Core S&P Small-Cap ETF (US:IJR) , Apple Inc. (US:AAPL) , Cintas Corporation (US:CTAS) , and Microsoft Corporation (US:MSFT) . Peninsula Asset Management Inc’s new positions include NVIDIA Corporation (US:NVDA) , .
Top Increases This Quarter
We use the change in the portfolio allocation because this is the most meaningful metric. Changes can be due to trades or changes in share prices.
| Security | Shares (MM) |
Value (MM$) |
Portfolio % | ΔPortfolio % |
|---|---|---|---|---|
| 0.03 | 4.00 | 2.1102 | 2.1102 | |
| 0.02 | 9.74 | 5.1412 | 1.1078 | |
| 0.00 | 1.36 | 0.7059 | 0.3743 | |
| 0.04 | 5.71 | 2.9553 | 0.3706 | |
| 0.02 | 3.18 | 1.6783 | 0.3176 | |
| 0.03 | 5.32 | 2.7508 | 0.2154 | |
| 0.06 | 5.99 | 3.1611 | 0.1678 | |
| 0.01 | 3.24 | 1.6743 | 0.1299 | |
| 0.02 | 5.39 | 2.8462 | 0.0854 | |
| 0.02 | 7.33 | 3.8672 | 0.0567 |
Top Decreases This Quarter
We use the change in the portfolio allocation because this is the most meaningful metric. Changes can be due to trades or changes in share prices.
| Security | Shares (MM) |
Value (MM$) |
Portfolio % | ΔPortfolio % |
|---|---|---|---|---|
| 0.04 | 9.79 | 5.0636 | -0.9803 | |
| 0.05 | 9.84 | 5.0906 | -0.8509 | |
| 0.02 | 2.74 | 1.4196 | -0.6251 | |
| 0.06 | 6.54 | 3.4538 | -0.3915 | |
| 0.02 | 3.14 | 1.6598 | -0.3816 | |
| 0.03 | 6.63 | 3.4982 | -0.3761 | |
| 0.02 | 2.72 | 1.4062 | -0.2745 | |
| 0.02 | 2.47 | 1.2786 | -0.2604 | |
| 0.02 | 6.86 | 3.6227 | -0.2393 | |
| 0.07 | 4.52 | 2.3388 | -0.2107 |
13F and Fund Filings
This form was filed on 2025-08-07 for the reporting period 2025-06-30. Click the link icon to see the full transaction history.
Upgrade to unlock premium data and export to Excel ![]() .
.
| Security | Type | Avg Share Price | Shares (MM) |
ΔShares (%) |
ΔShares (%) |
Value ($MM) |
Portfolio (%) |
ΔPortfolio (%) |
|
|---|---|---|---|---|---|---|---|---|---|
| IJH / iShares Trust - iShares Core S&P Mid-Cap ETF | 0.32 | -0.14 | 19.81 | 6.13 | 10.2476 | -0.1156 | |||
| IJR / iShares Trust - iShares Core S&P Small-Cap ETF | 0.11 | 0.52 | 11.51 | 5.06 | 5.9545 | -0.1290 | |||
| AAPL / Apple Inc. | 0.05 | -0.44 | 9.84 | -8.04 | 5.0906 | -0.8509 | |||
| CTAS / Cintas Corporation | 0.04 | -17.07 | 9.79 | -10.08 | 5.0636 | -0.9803 | |||
| MSFT / Microsoft Corporation | 0.02 | 1.17 | 9.74 | 34.06 | 5.1412 | 1.1078 | |||
| SPGI / S&P Global Inc. | 0.02 | 0.56 | 9.40 | 4.36 | 4.8629 | -0.1385 | |||
| SYK / Stryker Corporation | 0.02 | 0.42 | 7.33 | 6.73 | 3.8672 | 0.0567 | |||
| ADP / Automatic Data Processing, Inc. | 0.02 | 1.27 | 6.88 | 2.23 | 3.6329 | -0.1047 | |||
| SHW / The Sherwin-Williams Company | 0.02 | 0.33 | 6.86 | -1.34 | 3.6227 | -0.2393 | |||
| LOW / Lowe's Companies, Inc. | 0.03 | -0.18 | 6.63 | -5.04 | 3.4982 | -0.3761 | |||
| AFL / Aflac Incorporated | 0.06 | -0.41 | 6.54 | -5.53 | 3.4538 | -0.3915 | |||
| GWW / W.W. Grainger, Inc. | 0.01 | 0.52 | 6.26 | 5.85 | 3.3044 | 0.0214 | |||
| WMT / Walmart Inc. | 0.06 | -0.28 | 5.99 | 11.06 | 3.1611 | 0.1678 | |||
| EMR / Emerson Electric Co. | 0.04 | 0.92 | 5.71 | 22.73 | 2.9553 | 0.3706 | |||
| ECL / Ecolab Inc. | 0.02 | 2.01 | 5.39 | 8.43 | 2.8462 | 0.0854 | |||
| GOOGL / Alphabet Inc. | 0.03 | 2.18 | 5.32 | 16.45 | 2.7508 | 0.2154 | |||
| NEE / NextEra Energy, Inc. | 0.07 | 0.55 | 4.52 | -1.52 | 2.3388 | -0.2107 | |||
| ROP / Roper Technologies, Inc. | 0.01 | 0.64 | 4.28 | -3.26 | 2.2579 | -0.1962 | |||
| NVDA / NVIDIA Corporation | 0.03 | 4.00 | 2.1102 | 2.1102 | |||||
| ABT / Abbott Laboratories | 0.03 | -0.19 | 3.87 | 2.35 | 2.0014 | -0.0978 | |||
| IBM / International Business Machines Corporation | 0.01 | -1.84 | 3.24 | 16.36 | 1.6743 | 0.1299 | |||
| NUE / Nucor Corporation | 0.02 | 20.50 | 3.18 | 29.71 | 1.6783 | 0.3176 | |||
| PEP / PepsiCo, Inc. | 0.02 | -2.90 | 3.14 | -14.50 | 1.6598 | -0.3816 | |||
| NDSN / Nordson Corporation | 0.01 | 2.10 | 2.92 | 8.52 | 1.5397 | 0.0474 | |||
| SYY / Sysco Corporation | 0.04 | 0.51 | 2.88 | 1.44 | 1.4894 | -0.0864 | |||
| BDX / Becton, Dickinson and Company | 0.02 | -0.90 | 2.74 | -25.48 | 1.4196 | -0.6251 | |||
| BRO / Brown & Brown, Inc. | 0.02 | 0.76 | 2.72 | -10.21 | 1.4062 | -0.2745 | |||
| XOM / Exxon Mobil Corporation | 0.02 | -1.62 | 2.47 | -10.86 | 1.2786 | -0.2604 | |||
| CTSH / Cognizant Technology Solutions Corporation | 0.03 | 2.50 | 2.37 | 4.55 | 1.2508 | -0.0074 | |||
| HRL / Hormel Foods Corporation | 0.07 | -1.32 | 2.12 | -3.50 | 1.0969 | -0.1234 | |||
| WST / West Pharmaceutical Services, Inc. | 0.01 | 2.23 | 1.91 | -0.10 | 1.0076 | -0.0530 | |||
| SPY / SPDR S&P 500 ETF | 0.00 | -0.92 | 1.66 | 9.44 | 0.8581 | 0.0165 | |||
| MKC.V / McCormick & Company, Incorporated | 0.02 | -2.36 | 1.43 | -10.07 | 0.7393 | -0.1429 | |||
| IVV / iShares Trust - iShares Core S&P 500 ETF | 0.00 | 106.77 | 1.36 | 128.48 | 0.7059 | 0.3743 | |||
| CINF / Cincinnati Financial Corporation | 0.01 | -0.21 | 1.06 | 0.67 | 0.5586 | -0.0254 | |||
| QQQ / Invesco QQQ Trust, Series 1 | 0.00 | 3.58 | 0.80 | 21.87 | 0.4126 | 0.0492 | |||
| ALB / Albemarle Corporation | 0.01 | -4.97 | 0.73 | -17.33 | 0.3780 | -0.1126 | |||
| PG / The Procter & Gamble Company | 0.00 | -6.67 | 0.67 | -12.79 | 0.3459 | -0.0796 | |||
| SO / The Southern Company | 0.01 | 0.00 | 0.65 | 0.00 | 0.3368 | -0.0252 | |||
| DIS / The Walt Disney Company | 0.00 | -0.21 | 0.36 | 25.52 | 0.1860 | 0.0268 | |||
| BRK.B / Berkshire Hathaway Inc. | 0.00 | 0.00 | 0.33 | -8.82 | 0.1714 | -0.0303 | |||
| GLD / SPDR Gold Trust | 0.00 | -24.56 | 0.27 | -20.12 | 0.1448 | -0.0460 | |||
| VOO / Vanguard Index Funds - Vanguard S&P 500 ETF | 0.00 | -27.82 | 0.27 | -20.23 | 0.1410 | -0.0487 | |||
| JNJ / Johnson & Johnson | 0.00 | -14.51 | 0.25 | -21.25 | 0.1331 | -0.0446 | |||
| CL / Colgate-Palmolive Company | 0.00 | 0.00 | 0.22 | -2.68 | 0.1152 | -0.0097 |