Basic Stats
| Portfolio Value | $ 42,159,958 |
| Current Positions | 29 |
Latest Holdings, Performance, AUM (from 13F, 13D)
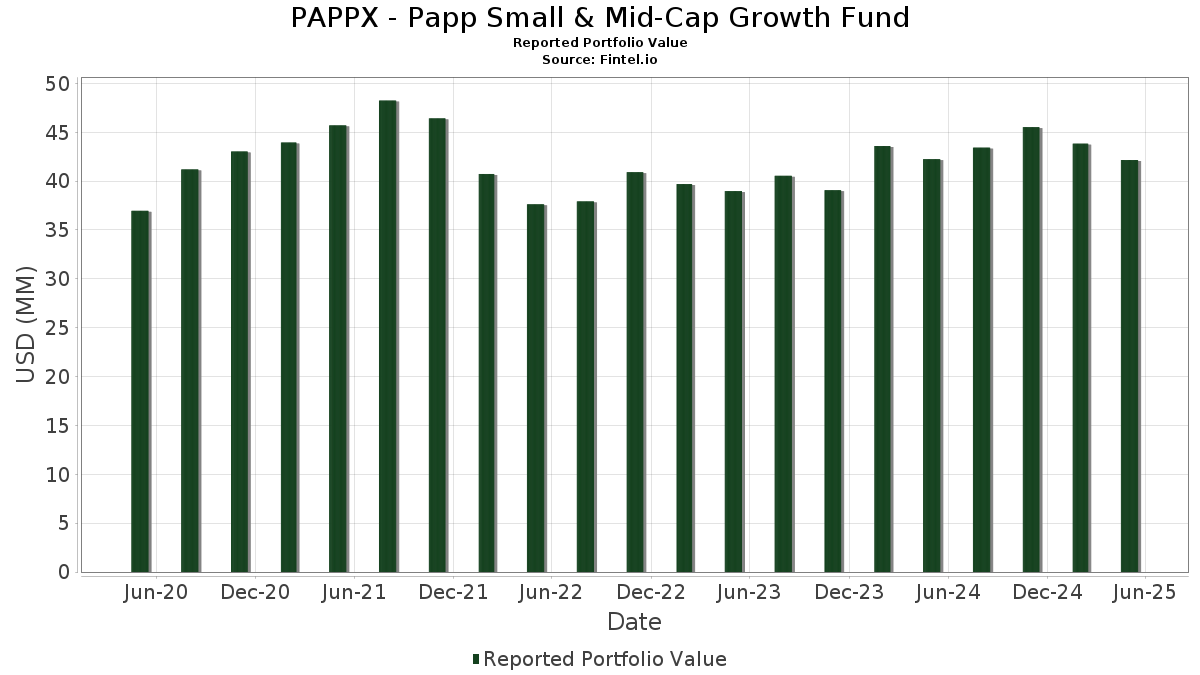
PAPPX - Papp Small & Mid-Cap Growth Fund has disclosed 29 total holdings in their latest SEC filings. Most recent portfolio value is calculated to be $ 42,159,958 USD. Actual Assets Under Management (AUM) is this value plus cash (which is not disclosed). PAPPX - Papp Small & Mid-Cap Growth Fund’s top holdings are O'Reilly Automotive, Inc. (US:ORLY) , RBC Bearings Incorporated (US:RBC) , AMETEK, Inc. (US:AME) , Ecolab Inc. (US:ECL) , and Expeditors International of Washington, Inc. (US:EXPD) . PAPPX - Papp Small & Mid-Cap Growth Fund’s new positions include Fidelity Colchester Street Trust - Fidelity Institutional Money Market Funds Government Portfolio Class I (US:FIGXX) , .
Top Increases This Quarter
We use the change in the portfolio allocation because this is the most meaningful metric. Changes can be due to trades or changes in share prices.
| Security | Shares (MM) |
Value (MM$) |
Portfolio % | ΔPortfolio % |
|---|---|---|---|---|
| 0.02 | 1.68 | 3.9841 | 0.9174 | |
| 0.04 | 0.93 | 2.2075 | 0.5123 | |
| 0.01 | 3.06 | 7.2393 | 0.4000 | |
| 0.00 | 3.51 | 8.3281 | 0.2780 | |
| 0.01 | 1.30 | 3.0743 | 0.2521 | |
| 0.01 | 2.34 | 5.5382 | 0.1683 | |
| 0.01 | 2.26 | 5.3464 | 0.1638 | |
| 0.01 | 2.66 | 6.2943 | 0.1600 | |
| 0.03 | 1.82 | 4.3066 | 0.1211 | |
| 0.03 | 1.93 | 4.5757 | 0.0115 |
Top Decreases This Quarter
We use the change in the portfolio allocation because this is the most meaningful metric. Changes can be due to trades or changes in share prices.
| Security | Shares (MM) |
Value (MM$) |
Portfolio % | ΔPortfolio % |
|---|---|---|---|---|
| 0.02 | 1.67 | 3.9603 | -0.3504 | |
| 0.00 | 2.18 | 5.1615 | -0.3092 | |
| 0.02 | 1.27 | 2.9988 | -0.2789 | |
| 0.01 | 0.86 | 2.0279 | -0.2436 | |
| 0.01 | 1.05 | 2.4839 | -0.2161 | |
| 0.80 | 1.8957 | -0.2113 | ||
| 0.01 | 0.32 | 0.7684 | -0.1750 | |
| 0.00 | 0.84 | 1.9928 | -0.1703 | |
| 0.01 | 1.99 | 4.7156 | -0.1588 | |
| 0.00 | 0.46 | 1.0938 | -0.1544 |
13F and Fund Filings
This form was filed on 2025-07-29 for the reporting period 2025-05-31. Click the link icon to see the full transaction history.
Upgrade to unlock premium data and export to Excel ![]() .
.
| Security | Type | Avg Share Price | Shares (MM) |
ΔShares (%) |
ΔShares (%) |
Value ($MM) |
Portfolio (%) |
ΔPortfolio (%) |
|
|---|---|---|---|---|---|---|---|---|---|
| ORLY / O'Reilly Automotive, Inc. | 0.00 | 0.00 | 3.51 | -0.45 | 8.3281 | 0.2780 | |||
| RBC / RBC Bearings Incorporated | 0.01 | 0.00 | 3.06 | 1.87 | 7.2393 | 0.4000 | |||
| AME / AMETEK, Inc. | 0.02 | 0.00 | 2.84 | -5.58 | 6.7345 | -0.1290 | |||
| ECL / Ecolab Inc. | 0.01 | 0.00 | 2.66 | -1.26 | 6.2943 | 0.1600 | |||
| EXPD / Expeditors International of Washington, Inc. | 0.02 | 0.00 | 2.49 | -3.93 | 5.9036 | -0.0107 | |||
| FDS / FactSet Research Systems Inc. | 0.01 | 0.00 | 2.34 | -0.72 | 5.5382 | 0.1683 | |||
| ANSS / ANSYS, Inc. | 0.01 | 0.00 | 2.26 | -0.70 | 5.3464 | 0.1638 | |||
| MTD / Mettler-Toledo International Inc. | 0.00 | 0.00 | 2.18 | -9.21 | 5.1615 | -0.3092 | |||
| IEX / IDEX Corporation | 0.01 | 0.00 | 1.99 | -6.88 | 4.7156 | -0.1588 | |||
| CSGP / CoStar Group, Inc. | 0.03 | 0.00 | 1.93 | -3.55 | 4.5757 | 0.0115 | |||
| TRMB / Trimble Inc. | 0.03 | 0.00 | 1.82 | -0.98 | 4.3066 | 0.1211 | |||
| PEGA / Pegasystems Inc. | 0.02 | 0.00 | 1.68 | 25.07 | 3.9841 | 0.9174 | |||
| CHD / Church & Dwight Co., Inc. | 0.02 | 0.00 | 1.67 | -11.59 | 3.9603 | -0.3504 | |||
| RMD / ResMed Inc. | 0.01 | 0.00 | 1.30 | 4.85 | 3.0743 | 0.2521 | |||
| MKC / McCormick & Company, Incorporated | 0.02 | 0.00 | 1.27 | -11.97 | 2.9988 | -0.2789 | |||
| TROW / T. Rowe Price Group, Inc. | 0.01 | 0.00 | 1.05 | -11.49 | 2.4839 | -0.2161 | |||
| INFA / Informatica Inc. | 0.04 | 0.00 | 0.93 | 25.30 | 2.2075 | 0.5123 | |||
| SLAB / Silicon Laboratories Inc. | 0.01 | 0.00 | 0.86 | -14.16 | 2.0279 | -0.2436 | |||
| NXPI / NXP Semiconductors N.V. | 0.00 | 0.00 | 0.84 | -11.39 | 1.9928 | -0.1703 | |||
| FIGXX / Fidelity Colchester Street Trust - Fidelity Institutional Money Market Funds Government Portfolio Class I | 0.80 | -13.53 | 1.8957 | -0.2113 | |||||
| VMI / Valmont Industries, Inc. | 0.00 | 0.00 | 0.80 | -8.62 | 1.8841 | -0.1019 | |||
| XBI / SPDR Series Trust - SPDR S&P Biotech ETF | 0.01 | 0.00 | 0.66 | -10.73 | 1.5575 | -0.1215 | |||
| DT / Dynatrace, Inc. | 0.01 | 0.00 | 0.54 | -5.59 | 1.2798 | -0.0256 | |||
| VVV / Valvoline Inc. | 0.01 | 0.00 | 0.51 | -6.08 | 1.2090 | -0.0314 | |||
| PR / Permian Resources Corporation | 0.04 | 0.00 | 0.50 | -10.48 | 1.1952 | -0.0899 | |||
| CLX / The Clorox Company | 0.00 | 0.00 | 0.46 | -15.72 | 1.0938 | -0.1544 | |||
| YETI / YETI Holdings, Inc. | 0.01 | 0.00 | 0.46 | -14.31 | 1.0790 | -0.1319 | |||
| POOL / Pool Corporation | 0.00 | 0.00 | 0.45 | -13.46 | 1.0684 | -0.1185 | |||
| TECH / Bio-Techne Corporation | 0.01 | 0.00 | 0.32 | -21.55 | 0.7684 | -0.1750 |