Basic Stats
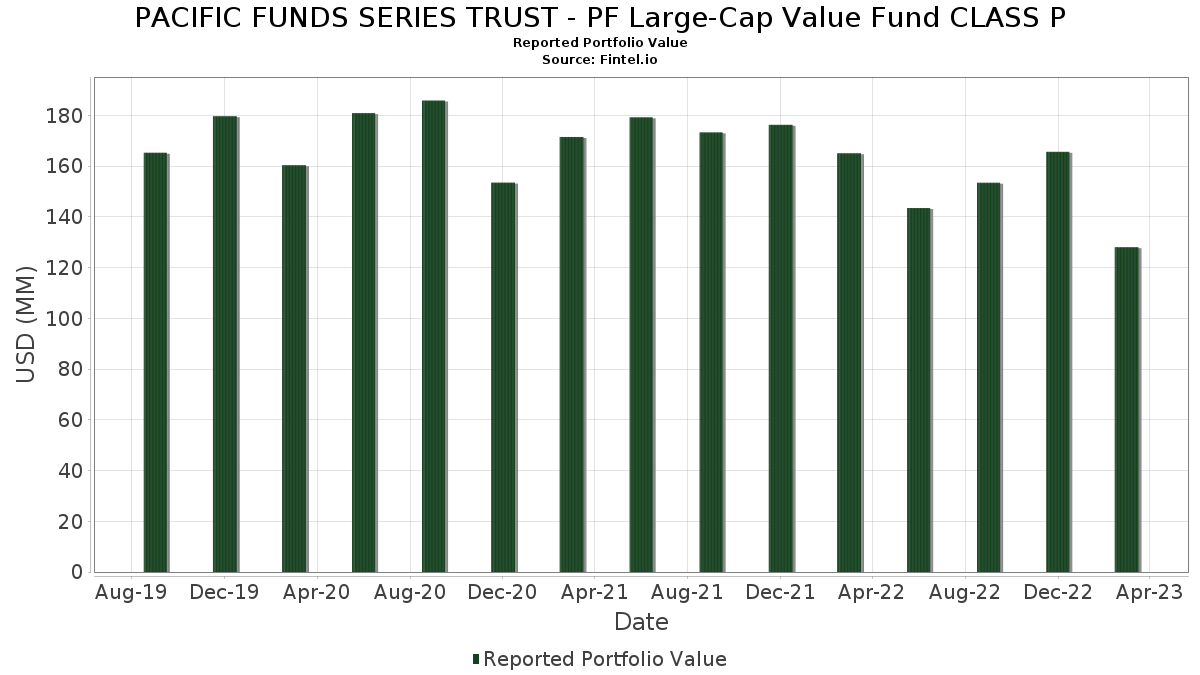
| Portfolio Value | $ 128,040,163 |
| Current Positions | 49 |
Latest Holdings, Performance, AUM (from 13F, 13D)
PACIFIC FUNDS SERIES TRUST - PF Large-Cap Value Fund CLASS P has disclosed 49 total holdings in their latest SEC filings. Most recent portfolio value is calculated to be $ 128,040,163 USD. Actual Assets Under Management (AUM) is this value plus cash (which is not disclosed). PACIFIC FUNDS SERIES TRUST - PF Large-Cap Value Fund CLASS P’s top holdings are Sempra (US:SRE) , ConocoPhillips (US:COP) , JPMorgan Chase & Co. (US:JPM) , American Express Company (US:AXP) , and RTX Corporation (US:RTX) .
Top Increases This Quarter
We use the change in the portfolio allocation because this is the most meaningful metric. Changes can be due to trades or changes in share prices.
| Security | Shares (MM) |
Value (MM$) |
Portfolio % | ΔPortfolio % |
|---|---|---|---|---|
| 0.02 | 3.77 | 2.8924 | 1.3047 | |
| 2.18 | 2.18 | 1.6752 | 0.7557 | |
| 0.03 | 4.03 | 3.0967 | 0.4468 | |
| 0.03 | 4.21 | 3.2305 | 0.4017 | |
| 0.01 | 3.90 | 2.9984 | 0.3584 | |
| 0.07 | 3.40 | 2.6120 | 0.2849 | |
| 0.01 | 2.74 | 2.1058 | 0.2610 | |
| 0.05 | 1.57 | 1.2066 | 0.2523 | |
| 0.04 | 2.59 | 1.9876 | 0.2364 | |
| 0.12 | 3.23 | 2.4835 | 0.2225 |
Top Decreases This Quarter
We use the change in the portfolio allocation because this is the most meaningful metric. Changes can be due to trades or changes in share prices.
| Security | Shares (MM) |
Value (MM$) |
Portfolio % | ΔPortfolio % |
|---|---|---|---|---|
| 0.00 | 0.00 | -1.3589 | ||
| 0.01 | 4.00 | 3.0693 | -1.2599 | |
| 0.02 | 1.08 | 0.8287 | -1.1132 | |
| 0.06 | 5.63 | 4.3204 | -0.7031 | |
| 0.14 | 4.08 | 3.1300 | -0.4135 | |
| 0.00 | 0.00 | -0.4011 | ||
| 0.01 | 1.48 | 1.1330 | -0.3690 | |
| 0.01 | 2.26 | 1.7380 | -0.3269 | |
| 0.09 | 0.85 | 0.6540 | -0.3081 | |
| 0.01 | 2.56 | 1.9646 | -0.3048 |
13F and Fund Filings
This form was filed on 2023-05-10 for the reporting period 2023-03-31. Click the link icon to see the full transaction history.
Upgrade to unlock premium data and export to Excel ![]() .
.
| Security | Type | Avg Share Price | Shares (MM) |
ΔShares (%) |
ΔShares (%) |
Value ($MM) |
Portfolio (%) |
ΔPortfolio (%) |
|
|---|---|---|---|---|---|---|---|---|---|
| SRE / Sempra | 0.04 | -19.65 | 5.80 | -21.41 | 4.4576 | 0.0024 | |||
| COP / ConocoPhillips | 0.06 | -19.64 | 5.63 | -32.44 | 4.3204 | -0.7031 | |||
| JPM / JPMorgan Chase & Co. | 0.04 | -19.64 | 4.86 | -21.92 | 3.7342 | -0.0225 | |||
| AXP / American Express Company | 0.03 | -19.64 | 4.21 | -10.28 | 3.2305 | 0.4017 | |||
| RTX / RTX Corporation | 0.04 | -19.64 | 4.20 | -22.02 | 3.2266 | -0.0240 | |||
| BAC / Bank of America Corporation | 0.14 | -19.64 | 4.08 | -30.61 | 3.1300 | -0.4135 | |||
| TEL / TE Connectivity plc | 0.03 | -19.64 | 4.03 | -8.22 | 3.0967 | 0.4468 | |||
| DE / Deere & Company | 0.01 | -42.16 | 4.00 | -44.31 | 3.0693 | -1.2599 | |||
| MSI / Motorola Solutions, Inc. | 0.01 | -19.64 | 3.90 | -10.79 | 2.9984 | 0.3584 | |||
| META / Meta Platforms, Inc. | 0.02 | -18.74 | 3.77 | 43.10 | 2.8924 | 1.3047 | |||
| UNH / UnitedHealth Group Incorporated | 0.01 | -19.65 | 3.65 | -28.38 | 2.8050 | -0.2716 | |||
| CVX / Chevron Corporation | 0.02 | -19.64 | 3.62 | -26.96 | 2.7779 | -0.2095 | |||
| CSCO / Cisco Systems, Inc. | 0.07 | -19.64 | 3.40 | -11.85 | 2.6120 | 0.2849 | |||
| EPD / Enterprise Products Partners L.P. - Limited Partnership | 0.12 | -19.65 | 3.23 | -13.72 | 2.4835 | 0.2225 | |||
| ANTM / Anthem Inc | 0.01 | -19.64 | 3.15 | -27.98 | 2.4184 | -0.2191 | |||
| APD / Air Products and Chemicals, Inc. | 0.01 | -19.65 | 2.95 | -25.15 | 2.2641 | -0.1117 | |||
| UPS / United Parcel Service, Inc. | 0.01 | -19.64 | 2.74 | -10.34 | 2.1058 | 0.2610 | |||
| EIX / Edison International | 0.04 | -19.65 | 2.59 | -10.85 | 1.9876 | 0.2364 | |||
| NOC / Northrop Grumman Corporation | 0.01 | -19.64 | 2.56 | -32.01 | 1.9646 | -0.3048 | |||
| LBRDA / Liberty Broadband Corporation | 0.01 | -18.74 | 2.55 | -14.28 | 1.9594 | 0.1633 | |||
| JNJ / Johnson & Johnson | 0.02 | -19.64 | 2.47 | -29.49 | 1.8988 | -0.2167 | |||
| PGR / The Progressive Corporation | 0.02 | -19.64 | 2.36 | -11.35 | 1.8111 | 0.2058 | |||
| BRK.B / Berkshire Hathaway Inc. | 0.01 | -19.64 | 2.31 | -19.68 | 1.7746 | 0.0391 | |||
| BDX / Becton, Dickinson and Company | 0.01 | -18.74 | 2.30 | -20.92 | 1.7662 | 0.0121 | |||
| V / Visa Inc. | 0.01 | -39.07 | 2.26 | -33.90 | 1.7380 | -0.3269 | |||
| ITW / Illinois Tool Works Inc. | 0.01 | -19.64 | 2.25 | -11.19 | 1.7254 | 0.1990 | |||
| US09248U7182 / BlackRock Liquidity Funds: T-Fund, Institutional Shares | 2.18 | 43.12 | 2.18 | 43.20 | 1.6752 | 0.7557 | |||
| HLNCF / Haleon plc | 0.27 | -18.74 | 2.16 | -17.34 | 1.6596 | 0.0828 | |||
| PEP / PepsiCo, Inc. | 0.01 | -19.64 | 2.13 | -18.94 | 1.6344 | 0.0511 | |||
| HD / The Home Depot, Inc. | 0.01 | -19.64 | 2.13 | -24.92 | 1.6338 | -0.0756 | |||
| PPG / PPG Industries, Inc. | 0.02 | -19.64 | 2.09 | -14.64 | 1.6089 | 0.1284 | |||
| AMT / American Tower Corporation | 0.01 | -19.64 | 2.08 | -22.48 | 1.5998 | -0.0217 | |||
| CMCSA / Comcast Corporation | 0.05 | -19.64 | 2.07 | -12.90 | 1.5880 | 0.1560 | |||
| MMC / Marsh & McLennan Companies, Inc. | 0.01 | -19.64 | 2.06 | -19.10 | 1.5845 | 0.0455 | |||
| VRT / Vertiv Holdings Co | 0.13 | -19.64 | 1.91 | -15.81 | 1.4649 | 0.0979 | |||
| TRV / The Travelers Companies, Inc. | 0.01 | -19.64 | 1.86 | -26.54 | 1.4314 | -0.0992 | |||
| ORCL / Oracle Corporation | 0.02 | -19.65 | 1.79 | -8.69 | 1.3723 | 0.1921 | |||
| MLM / Martin Marietta Materials, Inc. | 0.00 | -19.65 | 1.71 | -15.56 | 1.3128 | 0.0911 | |||
| OTIS / Otis Worldwide Corporation | 0.02 | -19.65 | 1.69 | -13.38 | 1.2975 | 0.1205 | |||
| MRK / Merck & Co., Inc. | 0.02 | -19.65 | 1.68 | -22.97 | 1.2907 | -0.0252 | |||
| AMGN / Amgen Inc. | 0.01 | -19.64 | 1.62 | -26.06 | 1.2449 | -0.0773 | |||
| BK / The Bank of New York Mellon Corporation | 0.04 | -19.65 | 1.60 | -19.79 | 1.2272 | 0.0254 | |||
| INTC / Intel Corporation | 0.05 | -19.64 | 1.57 | -0.63 | 1.2066 | 0.2523 | |||
| GOOGL / Alphabet Inc. | 0.01 | -49.60 | 1.48 | -40.74 | 1.1330 | -0.3690 | |||
| MSFT / Microsoft Corporation | 0.01 | -19.65 | 1.46 | -3.43 | 1.1248 | 0.2101 | |||
| SCHW / The Charles Schwab Corporation | 0.02 | -46.71 | 1.08 | -66.50 | 0.8287 | -1.1132 | |||
| QCOM / QUALCOMM Incorporated | 0.01 | -19.64 | 1.01 | -6.73 | 0.7771 | 0.1225 | |||
| USB / U.S. Bancorp | 0.03 | -19.65 | 0.96 | -33.56 | 0.7406 | -0.1353 | |||
| DISH / DISH Network Corporation | 0.09 | -19.65 | 0.85 | -46.61 | 0.6540 | -0.3081 | |||
| HON / Honeywell International Inc. | 0.00 | -100.00 | 0.00 | -100.00 | -1.3589 | ||||
| AAPL / Apple Inc. | 0.00 | -100.00 | 0.00 | -100.00 | -0.4011 |