Basic Stats
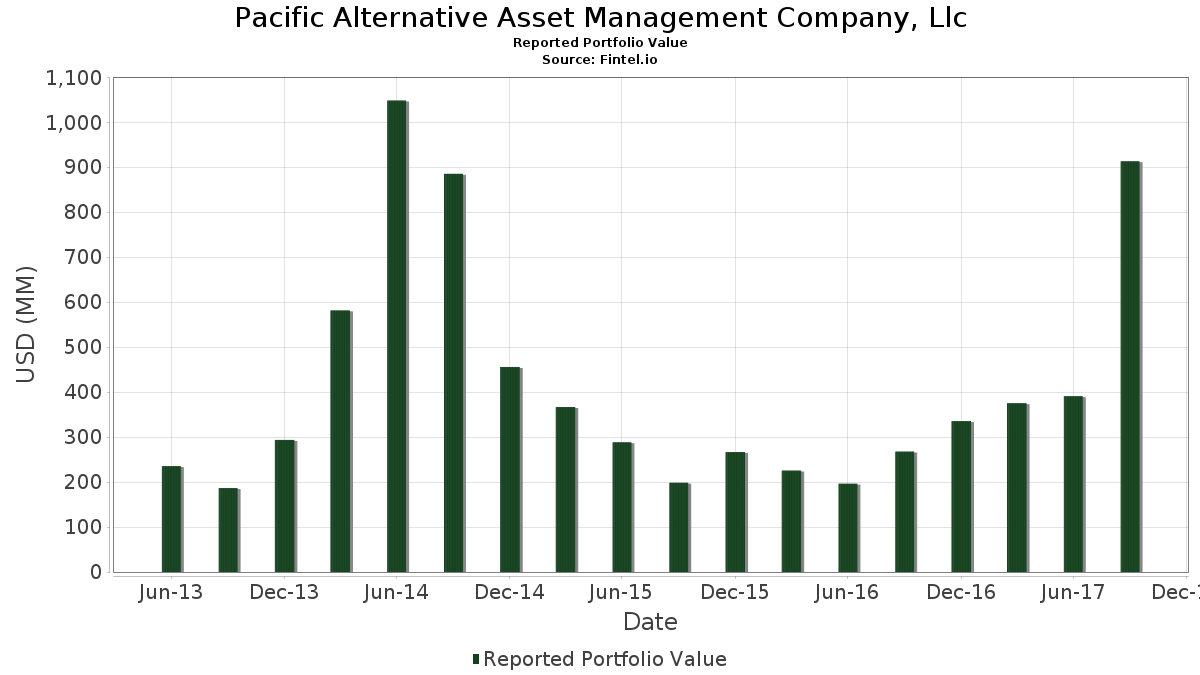
| Portfolio Value | $ 913,162,000 |
| Current Positions | 112 |
Latest Holdings, Performance, AUM (from 13F, 13D)
Pacific Alternative Asset Management Company, Llc has disclosed 112 total holdings in their latest SEC filings. Most recent portfolio value is calculated to be $ 913,162,000 USD. Actual Assets Under Management (AUM) is this value plus cash (which is not disclosed). Pacific Alternative Asset Management Company, Llc’s top holdings are NXP Semiconductors N.V. (US:NXPI) , Warner Media LLC (US:TWX) , SPDR S&P 500 ETF (US:SPY) , The Select Sector SPDR Trust - The Energy Select Sector SPDR Fund (US:XLE) , and The Select Sector SPDR Trust - The Energy Select Sector SPDR Fund (US:XLE) . Pacific Alternative Asset Management Company, Llc’s new positions include The Select Sector SPDR Trust - The Energy Select Sector SPDR Fund (US:XLE) , The Select Sector SPDR Trust - The Energy Select Sector SPDR Fund (US:XLE) , SPDR Gold Trust (US:GLD) , SPDR Gold Trust (US:GLD) , and iShares Trust - iShares 20+ Year Treasury Bond ETF (US:TLT) .
Top Increases This Quarter
We use the change in the portfolio allocation because this is the most meaningful metric. Changes can be due to trades or changes in share prices.
| Security | Shares (MM) |
Value (MM$) |
Portfolio % | ΔPortfolio % |
|---|---|---|---|---|
| 0.83 | 85.48 | 9.3606 | 9.3606 | |
| 0.66 | 44.99 | 4.9269 | 4.9269 | |
| 0.64 | 43.92 | 4.8092 | 4.8092 | |
| 0.35 | 42.32 | 4.6346 | 4.6346 | |
| 0.32 | 38.52 | 4.2179 | 4.2179 | |
| 0.20 | 25.45 | 2.7872 | 2.7872 | |
| 0.19 | 23.89 | 2.6163 | 2.6163 | |
| 0.36 | 20.90 | 2.2886 | 2.2886 | |
| 0.06 | 19.22 | 2.1048 | 2.1048 | |
| 0.05 | 17.36 | 1.9012 | 1.9012 |
Top Decreases This Quarter
We use the change in the portfolio allocation because this is the most meaningful metric. Changes can be due to trades or changes in share prices.
| Security | Shares (MM) |
Value (MM$) |
Portfolio % | ΔPortfolio % |
|---|---|---|---|---|
| 0.87 | 98.74 | 10.8128 | -8.9960 | |
| 0.21 | 53.36 | 5.8435 | -3.6267 | |
| 0.48 | 15.31 | 1.6771 | -2.8838 | |
| 0.05 | 9.36 | 1.0248 | -2.0729 | |
| 0.12 | 9.41 | 1.0309 | -1.9161 | |
| 0.44 | 27.70 | 3.0329 | -1.3661 | |
| 0.16 | 24.09 | 2.6385 | -1.2872 | |
| 0.02 | 1.98 | 0.2173 | -0.6773 | |
| 0.00 | 1.51 | 0.1656 | -0.3588 | |
| 0.00 | 0.00 | -0.3584 |
13F and Fund Filings
This form was filed on 2017-11-14 for the reporting period 2017-09-30. Click the link icon to see the full transaction history.
Upgrade to unlock premium data and export to Excel ![]() .
.
| Security | Type | Avg Share Price | Shares (MM) |
ΔShares (%) |
ΔShares (%) |
Value ($MM) |
Portfolio (%) |
ΔPortfolio (%) |
|
|---|---|---|---|---|---|---|---|---|---|
| NXPI / NXP Semiconductors N.V. | 0.87 | 23.41 | 98.74 | 27.51 | 10.8128 | -8.9960 | |||
| TWX / Warner Media LLC | 0.83 | 52.08 | 85.48 | 55.17 | 9.3606 | 9.3606 | |||
| SPY / SPDR S&P 500 ETF | Put | 0.21 | 38.73 | 53.36 | 44.14 | 5.8435 | -3.6267 | ||
| XLE / The Select Sector SPDR Trust - The Energy Select Sector SPDR Fund | Call | 0.66 | 44.99 | 4.9269 | 4.9269 | ||||
| XLE / The Select Sector SPDR Trust - The Energy Select Sector SPDR Fund | Put | 0.64 | 43.92 | 4.8092 | 4.8092 | ||||
| GLD / SPDR Gold Trust | Call | 0.35 | 42.32 | 4.6346 | 4.6346 | ||||
| GLD / SPDR Gold Trust | Put | 0.32 | 38.52 | 4.2179 | 4.2179 | ||||
| NXST / Nexstar Media Group, Inc. | 0.44 | 54.59 | 27.70 | 61.05 | 3.0329 | -1.3661 | |||
| TLT / iShares Trust - iShares 20+ Year Treasury Bond ETF | Call | 0.20 | 25.45 | 2.7872 | 2.7872 | ||||
| IWM / iShares Trust - iShares Russell 2000 ETF | Put | 0.16 | 49.31 | 24.09 | 57.01 | 2.6385 | -1.2872 | ||
| TLT / iShares Trust - iShares 20+ Year Treasury Bond ETF | Put | 0.19 | 23.89 | 2.6163 | 2.6163 | ||||
| VGK / Vanguard International Equity Index Funds - Vanguard FTSE Europe ETF | Put | 0.36 | 20.90 | 2.2886 | 2.2886 | ||||
| MDY / SPDR S&P MidCap 400 ETF Trust | Put | 0.06 | 19.22 | 2.1048 | 2.1048 | ||||
| MDY / SPDR S&P MidCap 400 ETF Trust | Call | 0.05 | 17.36 | 1.9012 | 1.9012 | ||||
| EEM / iShares, Inc. - iShares MSCI Emerging Markets ETF | Put | 0.35 | 15.64 | 1.7126 | 1.7126 | ||||
| SBGI / Sinclair, Inc. | 0.48 | -11.82 | 15.31 | -14.10 | 1.6771 | -2.8838 | |||
| XRT / SPDR Series Trust - SPDR S&P Retail ETF | Put | 0.34 | 14.31 | 1.5671 | 1.5671 | ||||
| SPY / SPDR S&P 500 ETF | 0.05 | 13.81 | 1.5124 | 1.5124 | |||||
| KRE / SPDR Series Trust - SPDR S&P Regional Banking ETF | Call | 0.23 | 12.88 | 1.4103 | 1.4103 | ||||
| FEZ / SPDR Index Shares Funds - SPDR EURO STOXX 50 ETF | Put | 0.31 | 12.74 | 1.3954 | 1.3954 | ||||
| KRE / SPDR Series Trust - SPDR S&P Regional Banking ETF | Put | 0.19 | 10.87 | 1.1905 | 1.1905 | ||||
| EWZ / iShares, Inc. - iShares MSCI Brazil ETF | 0.24 | 202.11 | 9.91 | 268.96 | 1.0857 | 0.3983 | |||
| DELL / Dell Technologies Inc. | 0.12 | -35.32 | 9.41 | -18.28 | 1.0309 | -1.9161 | |||
| BAP / Credicorp Ltd. | 0.05 | -32.38 | 9.36 | -22.72 | 1.0248 | -2.0729 | |||
| AVHOQ / Avianca Holdings S.A - ADR | 1.00 | 46.33 | 7.75 | 74.70 | 0.8492 | -0.2863 | |||
| XLF / The Select Sector SPDR Trust - The Financial Select Sector SPDR Fund | 0.29 | 7.61 | 0.8330 | 0.8330 | |||||
| LLL / JX Luxventure Limited | 0.04 | 119.18 | 7.56 | 147.20 | 0.8276 | 0.8276 | |||
| LAUR / Laureate Education, Inc. | 0.47 | 6.77 | 0.7417 | 0.7417 | |||||
| DIA / SPDR Dow Jones Industrial Average ETF Trust | 0.03 | 6.37 | 0.6977 | 0.6977 | |||||
| GLD / SPDR Gold Trust | 0.05 | 5.99 | 0.6562 | 0.6562 | |||||
| BANC / Banc of California, Inc. | 0.26 | 18.94 | 5.30 | 14.81 | 0.5808 | 0.5808 | |||
| FPH / Five Point Holdings, LLC | 0.36 | 7.25 | 4.95 | -0.88 | 0.5417 | 0.5417 | |||
| KMT / Kennametal Inc. | 0.12 | 4.94 | 0.5408 | 0.5408 | |||||
| APD / Air Products and Chemicals, Inc. | 0.03 | 111.03 | 4.91 | 123.06 | 0.5371 | 0.5371 | |||
| RSX / VanEck ETF Trust - VanEck Russia ETF | 0.22 | 4.83 | 0.5292 | 0.5292 | |||||
| US05491N1046 / BBX Capital Corporation | 0.65 | 4.82 | 0.5282 | 0.5282 | |||||
| UNVR / Univar Solutions Inc | 0.16 | 256.05 | 4.50 | 252.71 | 0.4925 | 0.4925 | |||
| TMUS / T-Mobile US, Inc. | 0.07 | 24.88 | 4.50 | 27.04 | 0.4924 | 0.4924 | |||
| JCI / Johnson Controls International plc | 0.11 | 4.32 | 0.4728 | 0.4728 | |||||
| TLT / iShares Trust - iShares 20+ Year Treasury Bond ETF | 0.03 | 4.31 | 0.4724 | 0.4724 | |||||
| RTN / Raytheon Co. | 0.02 | 246.27 | 4.31 | 300.09 | 0.4719 | 0.4719 | |||
| ETN / Eaton Corporation plc | 0.06 | 514.53 | 4.29 | 506.65 | 0.4697 | 0.4697 | |||
| DE / Deere & Company | 0.03 | 4.27 | 0.4678 | 0.4678 | |||||
| AGCO / AGCO Corporation | 0.06 | 464.78 | 4.25 | 518.17 | 0.4657 | 0.4657 | |||
| CMI / Cummins Inc. | 0.03 | 4.24 | 0.4645 | 0.4645 | |||||
| VC / Visteon Corporation | 0.03 | -40.82 | 3.69 | -28.24 | 0.4035 | 0.4035 | |||
| BCS / Barclays PLC - Depositary Receipt (Common Stock) | Call | 0.09 | 3.55 | 0.3888 | 0.3888 | ||||
| ADNT / Adient plc | 0.04 | 154.41 | 3.51 | 226.72 | 0.3843 | 0.3843 | |||
| VGK / Vanguard International Equity Index Funds - Vanguard FTSE Europe ETF | 0.06 | 3.47 | 0.3800 | 0.3800 | |||||
| MTOR / Meritor Inc | 0.13 | 29.28 | 3.42 | 102.37 | 0.3741 | 0.3741 | |||
| GDI / Gardner Denver Holdings, Inc. | 0.12 | 305.95 | 3.41 | 416.84 | 0.3730 | 0.3730 | |||
| IIN / IntriCon Corporation | 0.28 | -5.57 | 3.35 | 39.77 | 0.3664 | 0.3664 | |||
| ENIA / Enel Americas SA - ADR | 0.33 | 3.34 | 0.3653 | 0.3653 | |||||
| HUN / Huntsman Corporation | 0.12 | 191.37 | 3.27 | 209.27 | 0.3580 | 0.3580 | |||
| WM / Waste Management, Inc. | 0.04 | 3.24 | 0.3551 | 0.3551 | |||||
| HXL / Hexcel Corporation | 0.06 | 111.13 | 3.22 | 129.60 | 0.3525 | 0.3525 | |||
| HON / Honeywell International Inc. | 0.02 | 106.77 | 3.15 | 119.83 | 0.3447 | 0.3447 | |||
| DAN / Dana Incorporated | 0.11 | 3.01 | 0.3294 | 0.3294 | |||||
| CAT / Caterpillar Inc. | 0.02 | -8.81 | 2.96 | 5.82 | 0.3244 | 0.3244 | |||
| NYRT / New York REIT, Inc. | 0.30 | 2.37 | 0.2598 | 0.2598 | |||||
| PNK / Pinnacle Entertainment, Inc. | 0.11 | 32.02 | 2.33 | 42.40 | 0.2556 | -0.1637 | |||
| DOW / Dow Inc. | 0.03 | 2.21 | 0.2416 | 0.2416 | |||||
| RTX / RTX Corporation | 0.02 | 2.18 | 0.2384 | 0.2384 | |||||
| HII / Huntington Ingalls Industries, Inc. | 0.01 | 2.16 | 0.2368 | 0.2368 | |||||
| / Delphi Technologies PLC | 0.02 | 78.65 | 2.15 | 100.65 | 0.2353 | 0.2353 | |||
| LHX / L3Harris Technologies, Inc. | 0.02 | 2.13 | 0.2334 | 0.2334 | |||||
| FTV / Fortive Corporation | 0.03 | 2.12 | 0.2319 | 0.2319 | |||||
| PNR / Pentair plc | 0.03 | 189.29 | 2.11 | 195.52 | 0.2314 | 0.2314 | |||
| DOV / Dover Corporation | 0.02 | 28.96 | 2.09 | 46.94 | 0.2287 | 0.2287 | |||
| XRT / SPDR Series Trust - SPDR S&P Retail ETF | 0.05 | 2.02 | 0.2213 | 0.2213 | |||||
| V / Visa Inc. | 0.02 | -49.45 | 1.98 | -43.27 | 0.2173 | -0.6773 | |||
| AABA / Altaba Inc | 0.03 | -68.24 | 1.96 | -61.38 | 0.2145 | 0.2145 | |||
| NYCB / Flagstar Financial, Inc. | 0.15 | 2.65 | 1.88 | 0.81 | 0.2057 | 0.2057 | |||
| ZAYO / Zayo Group Holdings, Inc. | 0.05 | -19.11 | 1.81 | -9.87 | 0.1980 | -0.3152 | |||
| CMCSA / Comcast Corporation | 0.05 | 41.79 | 1.80 | 40.19 | 0.1971 | -0.1313 | |||
| FEZ / SPDR Index Shares Funds - SPDR EURO STOXX 50 ETF | 0.04 | 1.63 | 0.1789 | 0.1789 | |||||
| BAC / Bank of America Corporation | 0.06 | -0.97 | 1.63 | 3.43 | 0.1782 | -0.2242 | |||
| EEM / iShares, Inc. - iShares MSCI Emerging Markets ETF | 0.04 | -34.93 | 1.61 | -24.38 | 0.1763 | 0.1763 | |||
| XOP / SPDR Series Trust - SPDR S&P Oil & Gas Exploration & Production ETF | 0.05 | 1.59 | 0.1746 | 0.1746 | |||||
| SHW / The Sherwin-Williams Company | 0.00 | -3.01 | 1.56 | -1.08 | 0.1707 | 0.1707 | |||
| BFIN / BankFinancial Corporation | 0.10 | -32.35 | 1.53 | -27.94 | 0.1672 | 0.1672 | |||
| CHTR / Charter Communications, Inc. | 0.00 | -31.64 | 1.51 | -26.24 | 0.1656 | -0.3588 | |||
| US88104R2094 / TerraForm Power Inc. | 0.11 | 1.50 | 0.1648 | 0.1648 | |||||
| FNF / Fidelity National Financial, Inc. | 0.09 | 1.48 | 0.1622 | 0.1622 | |||||
| QSR / Restaurant Brands International Inc. | 0.02 | 74.12 | 1.22 | 77.91 | 0.1340 | 0.1340 | |||
| NLOK / NortonLifeLock Inc | 0.04 | 1.17 | 0.1277 | 0.1277 | |||||
| CIR / Circor International Inc | 0.02 | 1.14 | 0.1246 | 0.1246 | |||||
| BOX / Box, Inc. | 0.06 | -16.73 | 1.12 | -11.83 | 0.1224 | 0.1224 | |||
| CHRW / C.H. Robinson Worldwide, Inc. | 0.01 | 1.12 | 0.1223 | 0.1223 | |||||
| MAS / Masco Corporation | 0.03 | 1.06 | 0.1165 | 0.1165 | |||||
| URI / United Rentals, Inc. | 0.01 | 1.05 | 0.1148 | 0.1148 | |||||
| VNTV / Vantiv, Inc. | 0.01 | 1.04 | 0.1135 | 0.1135 | |||||
| US28470R1023 / Eldorado Resorts, Inc. | 0.04 | -21.93 | 0.94 | 0.21 | 0.1028 | 0.1028 | |||
| VNQ / Vanguard Specialized Funds - Vanguard Real Estate ETF | 0.01 | 0.80 | 0.0877 | 0.0877 | |||||
| ATUS / Altice USA, Inc. | 0.03 | -12.91 | 0.80 | -26.36 | 0.0872 | 0.0872 | |||
| XLY / The Select Sector SPDR Trust - The Consumer Discretionary Select Sector SPDR Fund | 0.01 | -39.44 | 0.76 | -3.29 | 0.0837 | 0.0837 | |||
| CFCO / CF Corporation | 0.06 | 78.79 | 0.71 | 78.00 | 0.0780 | 0.0780 | |||
| TGNA / TEGNA Inc. | 0.05 | -7.63 | 0.71 | -14.53 | 0.0773 | 0.0773 | |||
| CACQ / Caesars Acquisition Co. | 0.03 | 0.69 | 0.0752 | 0.0752 | |||||
| HACK / Amplify ETF Trust - Amplify Cybersecurity ETF | 0.02 | 0.62 | 0.0676 | 0.0676 | |||||
| QRTEA / Qurate Retail Inc - Series A | 0.01 | -28.98 | 0.59 | -21.87 | 0.0649 | -0.1292 | |||
| CCO / Clear Channel Outdoor Holdings, Inc. | 0.11 | 90.09 | 0.51 | 82.44 | 0.0557 | 0.0557 | |||
| XME / SPDR Series Trust - SPDR S&P Metals & Mining ETF | 0.02 | 0.51 | 0.0554 | 0.0554 | |||||
| ATKR / Atkore Inc. | 0.02 | 0.45 | 0.0493 | 0.0493 | |||||
| FTR / Frontier Communications Corp. | 0.02 | -61.08 | 0.29 | -74.53 | 0.0323 | 0.0323 | |||
| I / Intelsat SA | 0.05 | -41.71 | 0.26 | -10.49 | 0.0280 | 0.0280 | |||
| SMH / VanEck ETF Trust - VanEck Semiconductor ETF | 0.00 | 0.25 | 0.0272 | 0.0272 | |||||
| US25470MAB54 / DISH Network Corp. 3.375% Bond | 0.00 | 0.23 | 0.0257 | 0.0257 | |||||
| SNY / Sanofi - Depositary Receipt (Common Stock) | 0.39 | 0.00 | 0.14 | -5.44 | 0.0152 | -0.0224 | |||
| NXEO / Nexeo Solutions, Inc. | 0.11 | 0.05 | 0.0050 | 0.0050 | |||||
| WAC / Walter Investment Management Corp. | 0.06 | -31.14 | 0.03 | -57.69 | 0.0036 | 0.0036 | |||
| NIHD / NII Holdings, Inc. | 0.06 | 0.00 | 0.03 | -43.48 | 0.0028 | 0.0028 | |||
| FAST / Fastenal Company | 0.00 | -100.00 | 0.00 | -100.00 | 0.0000 | 0.0000 | |||
| COVS / Covisint Corporation | 0.00 | -100.00 | 0.00 | -100.00 | 0.0000 | 0.0000 | |||
| 698354AB3 / Pandora Media, Inc. Bond | 0.00 | -100.00 | 0.00 | -100.00 | 0.0000 | 0.0000 | |||
| GT / The Goodyear Tire & Rubber Company | 0.00 | -100.00 | 0.00 | -100.00 | -0.1780 | ||||
| ASH / Ashland Inc. | 0.00 | -100.00 | 0.00 | -100.00 | -0.3584 | ||||
| CTXS / Citrix Systems, Inc. | 0.00 | -100.00 | 0.00 | -100.00 | 0.0000 | 0.0000 | |||
| ATEX / Anterix Inc. | 0.00 | -100.00 | 0.00 | -100.00 | 0.0000 | 0.0000 | |||
| DOW / Dow Inc. | 0.00 | -100.00 | 0.00 | -100.00 | 0.0000 | 0.0000 | |||
| AXTA / Axalta Coating Systems Ltd. | 0.00 | -100.00 | 0.00 | -100.00 | 0.0000 | 0.0000 | |||
| TIP / iShares Trust - iShares TIPS Bond ETF | 0.00 | -100.00 | 0.00 | -100.00 | 0.0000 | 0.0000 | |||
| ALSN / Allison Transmission Holdings, Inc. | 0.00 | -100.00 | 0.00 | -100.00 | 0.0000 | 0.0000 | |||
| LOW / Lowe's Companies, Inc. | 0.00 | -100.00 | 0.00 | -100.00 | 0.0000 | 0.0000 | |||
| COL / Rockwell Collins, Inc. | 0.00 | -100.00 | 0.00 | -100.00 | 0.0000 | 0.0000 | |||
| WSO / Watsco, Inc. | 0.00 | -100.00 | 0.00 | -100.00 | 0.0000 | 0.0000 | |||
| F / Ford Motor Company | 0.00 | -100.00 | 0.00 | -100.00 | 0.0000 | 0.0000 | |||
| HD / The Home Depot, Inc. | 0.00 | -100.00 | 0.00 | -100.00 | 0.0000 | 0.0000 | |||
| PPG / PPG Industries, Inc. | 0.00 | -100.00 | 0.00 | -100.00 | 0.0000 | 0.0000 | |||
| 292764AB3 / EnerNOC, Inc. Bond | 0.00 | -100.00 | 0.00 | -100.00 | 0.0000 | 0.0000 |