Basic Stats
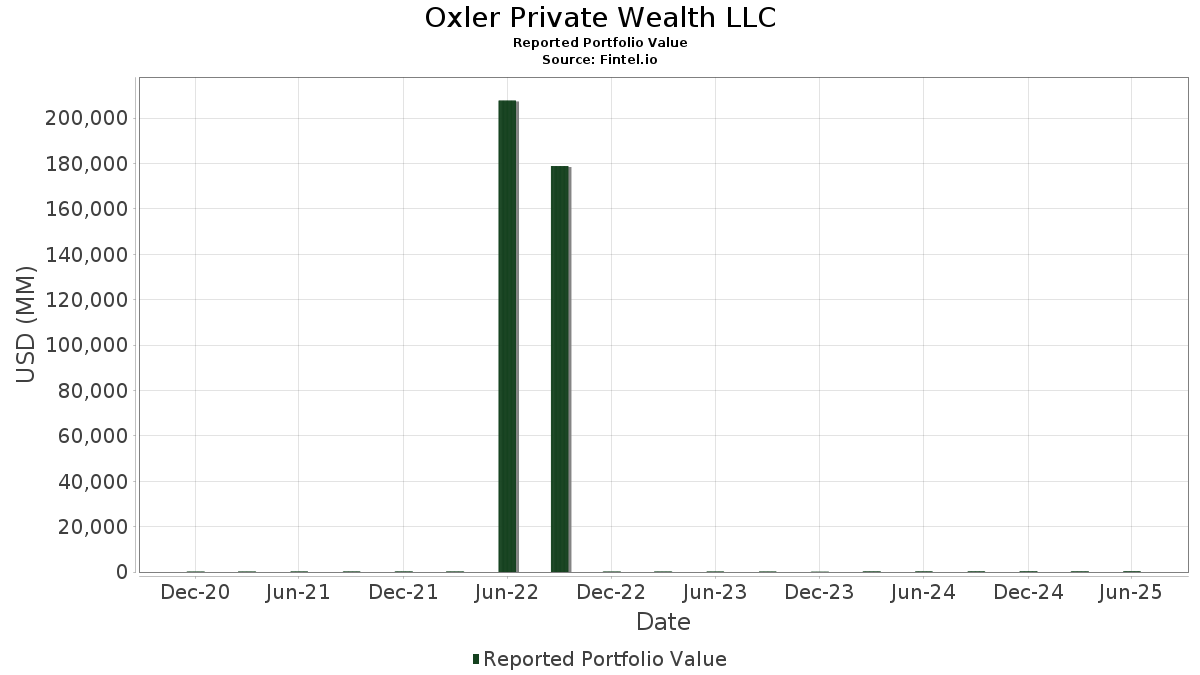
| Portfolio Value | $ 318,196,702 |
| Current Positions | 86 |
Latest Holdings, Performance, AUM (from 13F, 13D)
Oxler Private Wealth LLC has disclosed 86 total holdings in their latest SEC filings. Most recent portfolio value is calculated to be $ 318,196,702 USD. Actual Assets Under Management (AUM) is this value plus cash (which is not disclosed). Oxler Private Wealth LLC’s top holdings are Invesco QQQ Trust, Series 1 (US:QQQ) , Vanguard Index Funds - Vanguard S&P 500 ETF (US:VOO) , iShares Bitcoin Trust ETF (US:IBIT) , Amazon.com, Inc. (US:AMZN) , and Meta Platforms, Inc. (US:META) . Oxler Private Wealth LLC’s new positions include Listed Funds Trust - Roundhill Magnificent Seven ETF (US:MAGS) , .
Top Increases This Quarter
We use the change in the portfolio allocation because this is the most meaningful metric. Changes can be due to trades or changes in share prices.
| Security | Shares (MM) |
Value (MM$) |
Portfolio % | ΔPortfolio % |
|---|---|---|---|---|
| 0.08 | 43.37 | 13.6301 | 2.5451 | |
| 0.06 | 36.51 | 11.4745 | 1.9529 | |
| 0.51 | 31.26 | 9.8232 | 1.4936 | |
| 0.08 | 12.93 | 4.0644 | 0.9475 | |
| 0.03 | 15.58 | 4.8972 | 0.7566 | |
| 0.02 | 18.28 | 5.7445 | 0.5397 | |
| 0.01 | 0.57 | 0.1787 | 0.1787 | |
| 0.00 | 1.90 | 0.5984 | 0.1325 | |
| 0.00 | 1.54 | 0.4827 | 0.1062 | |
| 0.09 | 20.34 | 6.3937 | 0.0951 |
Top Decreases This Quarter
We use the change in the portfolio allocation because this is the most meaningful metric. Changes can be due to trades or changes in share prices.
| Security | Shares (MM) |
Value (MM$) |
Portfolio % | ΔPortfolio % |
|---|---|---|---|---|
| 0.01 | 0.41 | 0.1295 | -2.6018 | |
| 0.03 | 3.35 | 1.0534 | -1.2639 | |
| 0.04 | 8.43 | 2.6488 | -0.5724 | |
| 0.01 | 3.85 | 1.2104 | -0.5176 | |
| 0.05 | 3.94 | 1.2371 | -0.4241 | |
| 0.05 | 6.77 | 2.1278 | -0.2886 | |
| 0.01 | 4.73 | 1.4866 | -0.2711 | |
| 0.02 | 4.63 | 1.4560 | -0.2582 | |
| 0.02 | 3.16 | 0.9918 | -0.2490 | |
| 0.01 | 2.46 | 0.7728 | -0.2277 |
13F and Fund Filings
This form was filed on 2025-08-13 for the reporting period 2025-06-30. Click the link icon to see the full transaction history.
Upgrade to unlock premium data and export to Excel ![]() .
.
| Security | Type | Avg Share Price | Shares (MM) |
ΔShares (%) |
ΔShares (%) |
Value ($MM) |
Portfolio (%) |
ΔPortfolio (%) |
|
|---|---|---|---|---|---|---|---|---|---|
| QQQ / Invesco QQQ Trust, Series 1 | 0.08 | 16.85 | 43.37 | 37.47 | 13.6301 | 2.5451 | |||
| VOO / Vanguard Index Funds - Vanguard S&P 500 ETF | 0.06 | 21.89 | 36.51 | 34.73 | 11.4745 | 1.9529 | |||
| IBIT / iShares Bitcoin Trust ETF | 0.51 | 0.83 | 31.26 | 31.85 | 9.8232 | 1.4936 | |||
| AMZN / Amazon.com, Inc. | 0.09 | -1.58 | 20.34 | 13.49 | 6.3937 | 0.0951 | |||
| META / Meta Platforms, Inc. | 0.02 | -3.65 | 18.28 | 23.39 | 5.7445 | 0.5397 | |||
| MSFT / Microsoft Corporation | 0.03 | -0.21 | 15.58 | 32.23 | 4.8972 | 0.7566 | |||
| NVDA / NVIDIA Corporation | 0.08 | 0.01 | 12.93 | 45.78 | 4.0644 | 0.9475 | |||
| SPY / SPDR S&P 500 ETF | 0.02 | -0.77 | 11.64 | 9.61 | 3.6573 | -0.0733 | |||
| AAPL / Apple Inc. | 0.04 | -0.47 | 8.43 | -8.06 | 2.6488 | -0.5724 | |||
| GLD / SPDR Gold Trust | 0.02 | -0.14 | 7.12 | 5.65 | 2.2383 | -0.1304 | |||
| GOOGL / Alphabet Inc. | 0.04 | 0.09 | 7.08 | 14.06 | 2.2250 | 0.0441 | |||
| VYM / Vanguard Whitehall Funds - Vanguard High Dividend Yield ETF | 0.05 | -4.76 | 6.77 | -1.56 | 2.1278 | -0.2886 | |||
| GOOG / Alphabet Inc. | 0.04 | -0.14 | 6.65 | 13.39 | 2.0892 | 0.0293 | |||
| V / Visa Inc. | 0.01 | -1.70 | 5.32 | -0.41 | 1.6727 | -0.2053 | |||
| LLY / Eli Lilly and Company | 0.01 | 0.18 | 4.73 | -5.44 | 1.4866 | -0.2711 | |||
| VIG / Vanguard Specialized Funds - Vanguard Dividend Appreciation ETF | 0.02 | -10.00 | 4.63 | -5.04 | 1.4560 | -0.2582 | |||
| OKE / ONEOK, Inc. | 0.05 | 1.20 | 3.94 | -16.75 | 1.2371 | -0.4241 | |||
| TMO / Thermo Fisher Scientific Inc. | 0.01 | -3.90 | 3.85 | -21.70 | 1.2104 | -0.5176 | |||
| COST / Costco Wholesale Corporation | 0.00 | 0.11 | 3.71 | 4.78 | 1.1650 | -0.0780 | |||
| NOC / Northrop Grumman Corporation | 0.01 | -0.45 | 3.56 | -2.79 | 1.1174 | -0.1677 | |||
| IJS / iShares Trust - iShares S&P Small-Cap 600 Value ETF | 0.03 | -50.20 | 3.35 | -49.19 | 1.0534 | -1.2639 | |||
| ABBV / AbbVie Inc. | 0.02 | 0.87 | 3.16 | -10.65 | 0.9918 | -0.2490 | |||
| PANW / Palo Alto Networks, Inc. | 0.01 | 0.00 | 3.06 | 19.93 | 0.9608 | 0.0651 | |||
| AMGN / Amgen Inc. | 0.01 | -3.64 | 2.46 | -13.66 | 0.7728 | -0.2277 | |||
| ABT / Abbott Laboratories | 0.02 | -3.03 | 2.33 | -0.60 | 0.7334 | -0.0913 | |||
| IJJ / iShares Trust - iShares S&P Mid-Cap 400 Value ETF | 0.02 | -7.35 | 2.27 | -4.39 | 0.7121 | -0.1204 | |||
| ANET / Arista Networks Inc | 0.02 | 0.00 | 1.94 | 32.09 | 0.6107 | 0.0936 | |||
| SYK / Stryker Corporation | 0.00 | -0.02 | 1.91 | 6.22 | 0.6011 | -0.0315 | |||
| NFLX / Netflix, Inc. | 0.00 | 0.00 | 1.90 | 43.59 | 0.5984 | 0.1325 | |||
| SPYX / SPDR Series Trust - SPDR S&P 500 Fossil Fuel Reserves Free ETF | 0.04 | 0.20 | 1.88 | 11.55 | 0.5919 | -0.0014 | |||
| CMG / Chipotle Mexican Grill, Inc. | 0.03 | -2.54 | 1.83 | 8.99 | 0.5753 | -0.0148 | |||
| PEP / PepsiCo, Inc. | 0.01 | -2.37 | 1.82 | -14.06 | 0.5726 | -0.1720 | |||
| MCD / McDonald's Corporation | 0.01 | 0.32 | 1.82 | -6.13 | 0.5723 | -0.1096 | |||
| MSTR / Strategy Inc | 0.00 | 2.21 | 1.54 | 43.42 | 0.4827 | 0.1062 | |||
| JPM / JPMorgan Chase & Co. | 0.00 | 0.12 | 1.44 | 18.28 | 0.4537 | 0.0250 | |||
| TSLA / Tesla, Inc. | 0.00 | 0.00 | 1.26 | 22.67 | 0.3963 | 0.0348 | |||
| CMCSA / Comcast Corporation | 0.03 | -2.45 | 1.24 | -5.63 | 0.3898 | -0.0721 | |||
| PRU / Prudential Financial, Inc. | 0.01 | 1.27 | 1.22 | -2.55 | 0.3839 | -0.0566 | |||
| KO / The Coca-Cola Company | 0.02 | -8.32 | 1.17 | -9.48 | 0.3664 | -0.0859 | |||
| UNP / Union Pacific Corporation | 0.00 | 0.54 | 1.08 | -2.09 | 0.3391 | -0.0481 | |||
| CHD / Church & Dwight Co., Inc. | 0.01 | -13.18 | 1.06 | -24.18 | 0.3323 | -0.1579 | |||
| CRM / Salesforce, Inc. | 0.00 | -1.52 | 0.99 | 0.10 | 0.3100 | -0.0364 | |||
| BMY / Bristol-Myers Squibb Company | 0.02 | -2.51 | 0.98 | -26.00 | 0.3068 | -0.1567 | |||
| JNJ / Johnson & Johnson | 0.01 | -2.38 | 0.95 | -10.09 | 0.2996 | -0.0729 | |||
| IDXX / IDEXX Laboratories, Inc. | 0.00 | 0.00 | 0.90 | 27.76 | 0.2835 | 0.0353 | |||
| HSY / The Hershey Company | 0.01 | 0.79 | 0.85 | -2.19 | 0.2669 | -0.0382 | |||
| IWF / iShares Trust - iShares Russell 1000 Growth ETF | 0.00 | 0.05 | 0.78 | 17.77 | 0.2458 | 0.0123 | |||
| XLY / The Select Sector SPDR Trust - The Consumer Discretionary Select Sector SPDR Fund | 0.00 | -5.53 | 0.76 | 3.95 | 0.2403 | -0.0181 | |||
| DIS / The Walt Disney Company | 0.01 | -9.27 | 0.76 | 13.86 | 0.2379 | 0.0046 | |||
| XLK / The Select Sector SPDR Trust - The Technology Select Sector SPDR Fund | 0.00 | -1.91 | 0.75 | 20.32 | 0.2366 | 0.0167 | |||
| VRTX / Vertex Pharmaceuticals Incorporated | 0.00 | 0.00 | 0.75 | -8.14 | 0.2342 | -0.0509 | |||
| IVW / iShares Trust - iShares S&P 500 Growth ETF | 0.01 | 0.07 | 0.74 | 18.72 | 0.2335 | 0.0136 | |||
| AVGO / Broadcom Inc. | 0.00 | 0.24 | 0.70 | 65.09 | 0.2203 | 0.0710 | |||
| EES / WisdomTree Trust - WisdomTree U.S. SmallCap Fund | 0.01 | -8.96 | 0.67 | -5.10 | 0.2108 | -0.0373 | |||
| EZM / WisdomTree Trust - WisdomTree U.S. MidCap Fund | 0.01 | -5.51 | 0.66 | -2.08 | 0.2073 | -0.0293 | |||
| PRFZ / Invesco Exchange-Traded Fund Trust - Invesco RAFI US 1500 Small-Mid ETF | 0.02 | -6.04 | 0.62 | 0.97 | 0.1962 | -0.0211 | |||
| VTI / Vanguard Index Funds - Vanguard Total Stock Market ETF | 0.00 | 0.00 | 0.62 | 10.48 | 0.1957 | -0.0021 | |||
| IVE / iShares Trust - iShares S&P 500 Value ETF | 0.00 | -4.38 | 0.57 | -1.89 | 0.1798 | -0.0252 | |||
| MAGS / Listed Funds Trust - Roundhill Magnificent Seven ETF | 0.01 | 0.57 | 0.1787 | 0.1787 | |||||
| IWD / iShares Trust - iShares Russell 1000 Value ETF | 0.00 | -4.07 | 0.56 | -0.89 | 0.1757 | -0.0227 | |||
| VXUS / Vanguard STAR Funds - Vanguard Total International Stock ETF | 0.01 | -0.95 | 0.55 | 10.10 | 0.1716 | -0.0025 | |||
| BRK.B / Berkshire Hathaway Inc. | 0.00 | 0.00 | 0.49 | -8.82 | 0.1528 | -0.0345 | |||
| LNT / Alliant Energy Corporation | 0.01 | -8.71 | 0.48 | -14.10 | 0.1493 | -0.0453 | |||
| GS / The Goldman Sachs Group, Inc. | 0.00 | 0.32 | 0.45 | 30.03 | 0.1403 | 0.0196 | |||
| COWZ / Pacer Funds Trust - Pacer US Cash Cows 100 ETF | 0.01 | -94.73 | 0.41 | -94.70 | 0.1295 | -2.6018 | |||
| HD / The Home Depot, Inc. | 0.00 | 0.63 | 0.41 | 0.49 | 0.1295 | -0.0143 | |||
| DSI / iShares Trust - iShares ESG MSCI KLD 400 ETF | 0.00 | 0.22 | 0.37 | 13.89 | 0.1161 | 0.0019 | |||
| PG / The Procter & Gamble Company | 0.00 | 0.48 | 0.36 | -5.96 | 0.1142 | -0.0217 | |||
| SHAK / Shake Shack Inc. | 0.00 | 0.00 | 0.36 | 59.73 | 0.1137 | 0.0340 | |||
| VOOV / Vanguard Admiral Funds - Vanguard S&P 500 Value ETF | 0.00 | 0.47 | 0.36 | 3.14 | 0.1135 | -0.0098 | |||
| WCLD / WisdomTree Trust - WisdomTree Cloud Computing Fund | 0.01 | 0.00 | 0.35 | 11.46 | 0.1102 | -0.0004 | |||
| YUM / Yum! Brands, Inc. | 0.00 | -8.64 | 0.32 | -13.94 | 0.1010 | -0.0302 | |||
| ARKK / ARK ETF Trust - ARK Innovation ETF | 0.00 | 0.00 | 0.32 | 47.89 | 0.0991 | 0.0241 | |||
| XLV / The Select Sector SPDR Trust - The Health Care Select Sector SPDR Fund | 0.00 | -30.32 | 0.31 | -35.73 | 0.0986 | -0.0728 | |||
| CMS / CMS Energy Corporation | 0.00 | -2.44 | 0.31 | -10.03 | 0.0959 | -0.0233 | |||
| XLI / The Select Sector SPDR Trust - The Industrial Select Sector SPDR Fund | 0.00 | 0.30 | 0.30 | 12.88 | 0.0939 | 0.0009 | |||
| ES / Eversource Energy | 0.00 | 0.04 | 0.29 | 2.45 | 0.0924 | -0.0084 | |||
| RTX / RTX Corporation | 0.00 | 0.32 | 0.28 | 10.84 | 0.0867 | -0.0009 | |||
| QQQM / Invesco Exchange-Traded Fund Trust II - Invesco NASDAQ 100 ETF | 0.00 | 1.56 | 0.27 | 19.28 | 0.0839 | 0.0054 | |||
| VUG / Vanguard Index Funds - Vanguard Growth ETF | 0.00 | 0.00 | 0.25 | 18.31 | 0.0795 | 0.0043 | |||
| FVD / First Trust Exchange-Traded Fund - First Trust Value Line Dividend Index Fund | 0.01 | 0.56 | 0.25 | 0.81 | 0.0785 | -0.0085 | |||
| DTE / DTE Energy Company | 0.00 | -16.20 | 0.25 | -19.81 | 0.0777 | -0.0305 | |||
| DLR / Digital Realty Trust, Inc. | 0.00 | 0.24 | 0.0755 | 0.0755 | |||||
| CALF / Pacer Funds Trust - Pacer US Small Cap Cash Cows ETF | 0.01 | -70.25 | 0.21 | -68.49 | 0.0672 | -0.1706 | |||
| IBB / iShares Trust - iShares Biotechnology ETF | 0.00 | 0.00 | 0.20 | -0.99 | 0.0633 | -0.0082 | |||
| PESI / Perma-Fix Environmental Services, Inc. | 0.02 | 0.00 | 0.18 | 44.72 | 0.0562 | 0.0128 | |||
| PFE / Pfizer Inc. | 0.00 | -100.00 | 0.00 | 0.0000 |