Basic Stats
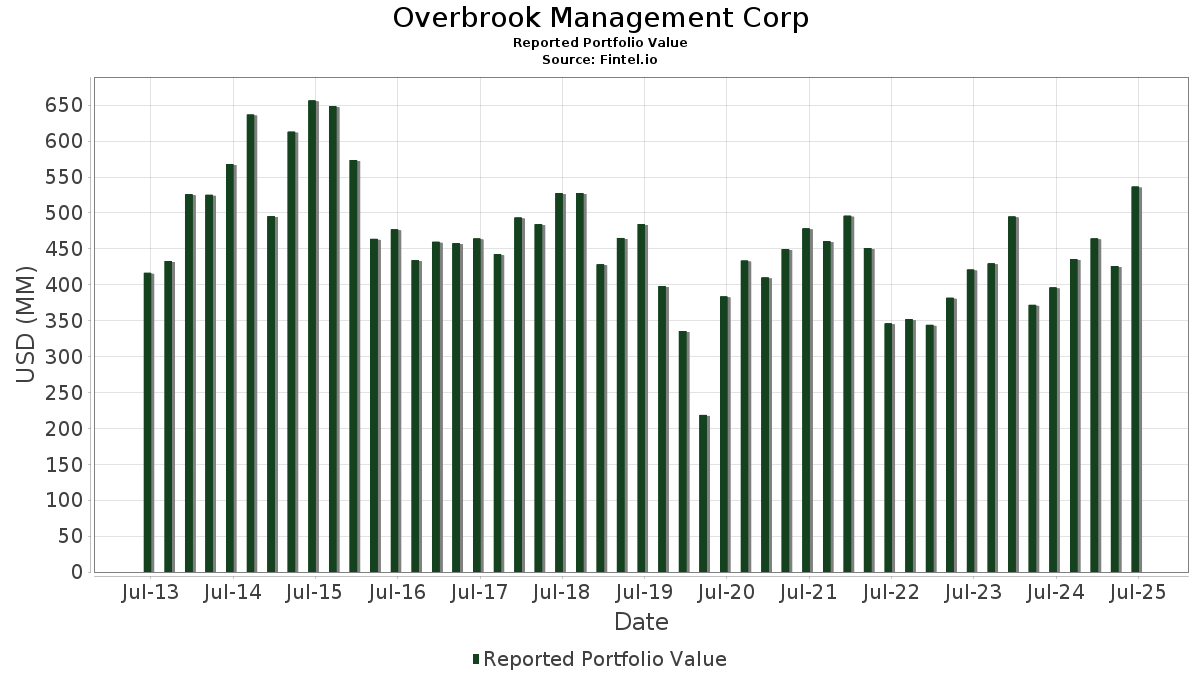
| Portfolio Value | $ 536,495,209 |
| Current Positions | 45 |
Latest Holdings, Performance, AUM (from 13F, 13D)
Overbrook Management Corp has disclosed 45 total holdings in their latest SEC filings. Most recent portfolio value is calculated to be $ 536,495,209 USD. Actual Assets Under Management (AUM) is this value plus cash (which is not disclosed). Overbrook Management Corp’s top holdings are Direxion Shares ETF Trust - Direxion Daily NVDA Bear 1X Shares (US:NVDD) , Microsoft Corporation (US:MSFT) , Meta Platforms, Inc. (US:META) , Amazon.com, Inc. (US:AMZN) , and Broadcom Inc. (US:AVGO) . Overbrook Management Corp’s new positions include MercadoLibre, Inc. (US:MELI) , Cibus, Inc. (US:CBUS) , .
Top Increases This Quarter
We use the change in the portfolio allocation because this is the most meaningful metric. Changes can be due to trades or changes in share prices.
| Security | Shares (MM) |
Value (MM$) |
Portfolio % | ΔPortfolio % |
|---|---|---|---|---|
| 0.01 | 14.63 | 2.7272 | 2.7272 | |
| 0.34 | 53.09 | 9.8965 | 2.3148 | |
| 0.03 | 21.33 | 3.9766 | 2.1443 | |
| 0.11 | 29.44 | 5.4874 | 1.7048 | |
| 0.05 | 34.71 | 6.4699 | 1.1825 | |
| 0.00 | 19.19 | 3.5761 | 1.1794 | |
| 0.02 | 6.95 | 1.2947 | 1.1715 | |
| 0.09 | 43.10 | 8.0341 | 1.0644 | |
| 0.00 | 4.48 | 0.8349 | 0.8349 | |
| 0.05 | 9.85 | 1.8353 | 0.4747 |
Top Decreases This Quarter
We use the change in the portfolio allocation because this is the most meaningful metric. Changes can be due to trades or changes in share prices.
| Security | Shares (MM) |
Value (MM$) |
Portfolio % | ΔPortfolio % |
|---|---|---|---|---|
| 0.07 | 13.91 | 2.5933 | -1.4705 | |
| 0.02 | 7.88 | 1.4683 | -1.2342 | |
| 0.10 | 23.02 | 4.2902 | -0.9805 | |
| 0.06 | 22.86 | 4.2602 | -0.9145 | |
| 0.14 | 12.80 | 2.3856 | -0.6968 | |
| 0.07 | 19.00 | 3.5419 | -0.5862 | |
| 0.05 | 4.97 | 0.9272 | -0.5129 | |
| 0.13 | 22.04 | 4.1088 | -0.4682 | |
| 0.09 | 12.32 | 2.2959 | -0.4494 | |
| 0.11 | 3.79 | 0.7066 | -0.3004 |
13F and Fund Filings
This form was filed on 2025-07-17 for the reporting period 2025-06-30. Click the link icon to see the full transaction history.
Upgrade to unlock premium data and export to Excel ![]() .
.
| Security | Type | Avg Share Price | Shares (MM) |
ΔShares (%) |
ΔShares (%) |
Value ($MM) |
Portfolio (%) |
ΔPortfolio (%) |
|
|---|---|---|---|---|---|---|---|---|---|
| NVDD / Direxion Shares ETF Trust - Direxion Daily NVDA Bear 1X Shares | 0.34 | 12.78 | 53.09 | 64.40 | 9.8965 | 2.3148 | |||
| MSFT / Microsoft Corporation | 0.09 | 9.57 | 43.10 | 45.18 | 8.0341 | 1.0644 | |||
| META / Meta Platforms, Inc. | 0.05 | 20.35 | 34.71 | 54.12 | 6.4699 | 1.1825 | |||
| AMZN / Amazon.com, Inc. | 0.16 | 15.95 | 34.24 | 33.71 | 6.3818 | 0.3702 | |||
| AVGO / Broadcom Inc. | 0.11 | 10.98 | 29.44 | 82.71 | 5.4874 | 1.7048 | |||
| GOOGL / Alphabet Inc. | 0.16 | 12.51 | 28.33 | 27.75 | 5.2811 | 0.0745 | |||
| TMUS / T-Mobile US, Inc. | 0.10 | 14.76 | 23.02 | 2.52 | 4.2902 | -0.9805 | |||
| V / Visa Inc. | 0.06 | 2.35 | 22.86 | 3.69 | 4.2602 | -0.9145 | |||
| ARES / Ares Management Corporation | 0.13 | -4.29 | 22.04 | 13.06 | 4.1088 | -0.4682 | |||
| LLY / Eli Lilly and Company | 0.03 | 189.61 | 21.33 | 173.37 | 3.9766 | 2.1443 | |||
| INTU / Intuit Inc. | 0.02 | 10.29 | 19.23 | 41.47 | 3.5838 | 0.3934 | |||
| BKNG / Booking Holdings Inc. | 0.00 | 49.55 | 19.19 | 87.94 | 3.5761 | 1.1794 | |||
| PGR / The Progressive Corporation | 0.07 | 14.60 | 19.00 | 8.06 | 3.5419 | -0.5862 | |||
| MELI / MercadoLibre, Inc. | 0.01 | 14.63 | 2.7272 | 2.7272 | |||||
| TSM / Taiwan Semiconductor Manufacturing Company Limited - Depositary Receipt (Common Stock) | 0.06 | -14.13 | 14.08 | 17.16 | 2.6238 | -0.1966 | |||
| AAPL / Apple Inc. | 0.07 | -12.98 | 13.91 | -19.63 | 2.5933 | -1.4705 | |||
| ORLY / O'Reilly Automotive, Inc. | 0.14 | 1,449.36 | 12.80 | -2.52 | 2.3856 | -0.6968 | |||
| APO / Apollo Global Management, Inc. | 0.09 | 1.67 | 12.32 | 5.34 | 2.2959 | -0.4494 | |||
| UBER / Uber Technologies, Inc. | 0.11 | 18.17 | 10.52 | 51.33 | 1.9603 | 0.3287 | |||
| GEV / GE Vernova Inc. | 0.02 | -28.10 | 9.99 | 24.62 | 1.8624 | -0.0198 | |||
| HWM / Howmet Aerospace Inc. | 0.05 | 18.41 | 9.85 | 69.91 | 1.8353 | 0.4747 | |||
| CRWD / CrowdStrike Holdings, Inc. | 0.02 | -11.42 | 9.58 | 27.96 | 1.7864 | 0.0280 | |||
| JPM / JPMorgan Chase & Co. | 0.03 | 1.54 | 8.95 | 20.01 | 1.6677 | -0.0826 | |||
| NOW / ServiceNow, Inc. | 0.01 | 1.38 | 8.75 | 30.93 | 1.6315 | 0.0619 | |||
| BRK.B / Berkshire Hathaway Inc. | 0.02 | -24.98 | 7.88 | -31.57 | 1.4683 | -1.2342 | |||
| GLD / SPDR Gold Trust | 0.02 | 1,150.66 | 6.95 | 1,225.57 | 1.2947 | 1.1715 | |||
| HQY / HealthEquity, Inc. | 0.05 | -31.59 | 4.97 | -18.91 | 0.9272 | -0.5129 | |||
| NFLX / Netflix, Inc. | 0.00 | 4.48 | 0.8349 | 0.8349 | |||||
| IBN / ICICI Bank Limited - Depositary Receipt (Common Stock) | 0.11 | -17.19 | 3.79 | -11.63 | 0.7066 | -0.3004 | |||
| GOOGL / Alphabet Inc. | 0.01 | 2.53 | 0.4715 | 0.4715 | |||||
| RPRX / Royalty Pharma plc | 0.05 | -17.46 | 1.74 | -4.51 | 0.3238 | -0.1031 | |||
| ICVT / iShares Trust - iShares Convertible Bond ETF | 0.02 | 0.00 | 1.59 | 7.81 | 0.2958 | -0.0499 | |||
| GLW / Corning Incorporated | 0.03 | 0.00 | 1.42 | 14.81 | 0.2647 | -0.0255 | |||
| EPD / Enterprise Products Partners L.P. - Limited Partnership | 0.04 | 0.00 | 1.19 | -9.20 | 0.2210 | -0.0855 | |||
| AL / Air Lease Corporation | 0.02 | 0.00 | 0.96 | 21.06 | 0.1790 | -0.0072 | |||
| GAM / General American Investors Company, Inc. | 0.02 | -10.27 | 0.92 | -0.22 | 0.1713 | -0.0448 | |||
| MA / Mastercard Incorporated | 0.00 | 0.83 | 0.1551 | 0.1551 | |||||
| XOM / Exxon Mobil Corporation | 0.00 | 0.00 | 0.41 | -9.25 | 0.0768 | -0.0299 | |||
| ADP / Automatic Data Processing, Inc. | 0.00 | -0.87 | 0.39 | 0.00 | 0.0724 | -0.0187 | |||
| EQIX / Equinix, Inc. | 0.00 | 0.00 | 0.35 | -2.48 | 0.0661 | -0.0192 | |||
| VOO / Vanguard Index Funds - Vanguard S&P 500 ETF | 0.00 | -20.46 | 0.33 | -11.97 | 0.0618 | -0.0267 | |||
| MCD / McDonald's Corporation | 0.00 | 0.00 | 0.32 | -6.41 | 0.0599 | -0.0208 | |||
| MDGL / Madrigal Pharmaceuticals, Inc. | 0.00 | -24.34 | 0.26 | -31.02 | 0.0482 | -0.0396 | |||
| AOSL / Alpha and Omega Semiconductor Limited | 0.01 | 0.00 | 0.21 | 3.40 | 0.0397 | -0.0087 | |||
| CBUS / Cibus, Inc. | 0.01 | 0.02 | 0.0033 | 0.0033 | |||||
| DHI / D.R. Horton, Inc. | 0.00 | -100.00 | 0.00 | 0.0000 | |||||
| INZY / Inozyme Pharma, Inc. | 0.00 | -100.00 | 0.00 | 0.0000 | |||||
| INAB / IN8bio, Inc. | 0.00 | -100.00 | 0.00 | 0.0000 | |||||
| CMG / Chipotle Mexican Grill, Inc. | 0.00 | -100.00 | 0.00 | 0.0000 | |||||
| JNJ / Johnson & Johnson | 0.00 | -100.00 | 0.00 | 0.0000 | |||||
| UNH / UnitedHealth Group Incorporated | 0.00 | -100.00 | 0.00 | 0.0000 | |||||
| MSCI / MSCI Inc. | 0.00 | -100.00 | 0.00 | 0.0000 |