Basic Stats
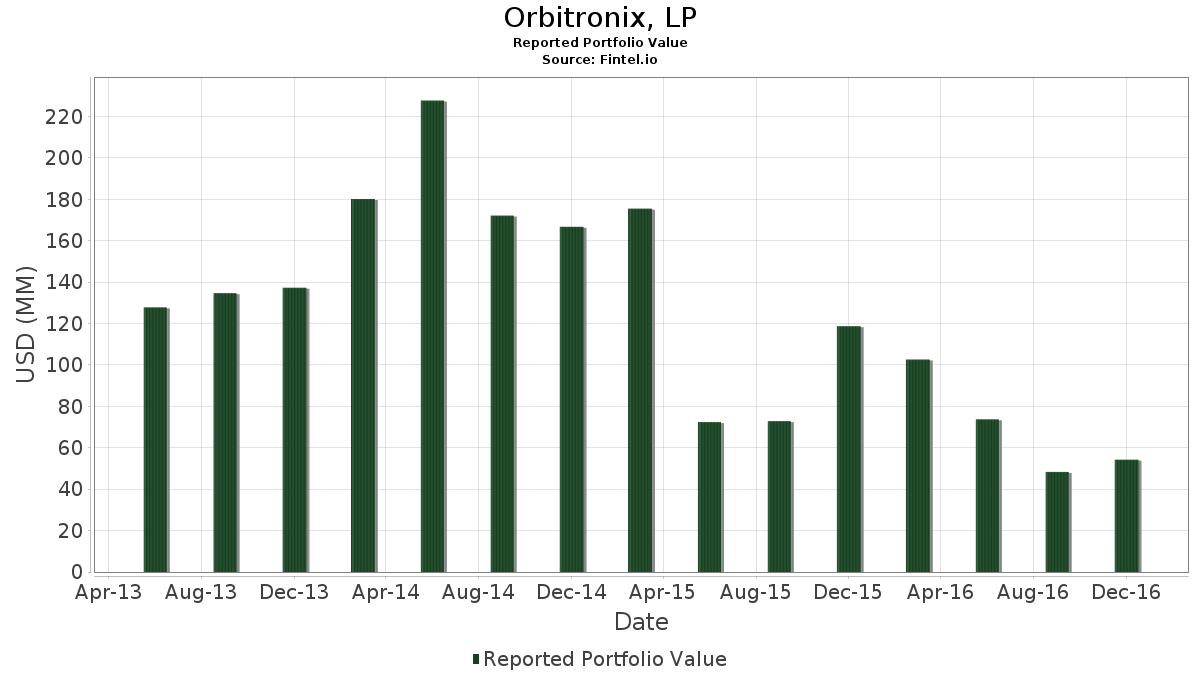
| Portfolio Value | $ 54,228,000 |
| Current Positions | 23 |
Latest Holdings, Performance, AUM (from 13F, 13D)
Orbitronix, LP has disclosed 23 total holdings in their latest SEC filings. Most recent portfolio value is calculated to be $ 54,228,000 USD. Actual Assets Under Management (AUM) is this value plus cash (which is not disclosed). Orbitronix, LP’s top holdings are SPDR Series Trust - SPDR S&P Oil & Gas Exploration & Production ETF (US:XOP) , Invesco CurrencyShares British Pound Sterling Trust (US:FXB) , Invesco CurrencyShares Euro Trust (US:FXE) , iShares Trust - iShares 20+ Year Treasury Bond ETF (US:TLT) , and iShares, Inc. - iShares MSCI Mexico ETF (US:EWW) . Orbitronix, LP’s new positions include SPDR Series Trust - SPDR S&P Oil & Gas Exploration & Production ETF (US:XOP) , iShares, Inc. - iShares MSCI Italy ETF (US:EWI) , Abercrombie & Fitch Co. (US:ANF) , Yum! Brands, Inc. (US:YUM) , and Barclays Bank PLC - ZC SP ETN REDEEM 23/01/2048 USD 50 - Ser B_COWB (US:COW) .
Top Increases This Quarter
We use the change in the portfolio allocation because this is the most meaningful metric. Changes can be due to trades or changes in share prices.
| Security | Shares (MM) |
Value (MM$) |
Portfolio % | ΔPortfolio % |
|---|---|---|---|---|
| 0.20 | 9.00 | 16.5966 | 16.5966 | |
| 0.07 | 6.16 | 11.3521 | 11.3521 | |
| 0.10 | 5.50 | 10.1424 | 10.1424 | |
| 0.07 | 7.82 | 14.4151 | 7.8678 | |
| 0.10 | 3.40 | 6.2698 | 6.2698 | |
| 0.10 | 3.04 | 5.6078 | 4.9769 | |
| 0.10 | 2.42 | 4.4645 | 4.4645 | |
| 0.01 | 1.22 | 2.2461 | 2.2461 | |
| 0.08 | 0.96 | 1.7703 | 1.7703 | |
| 0.01 | 0.80 | 1.4753 | 1.4753 |
Top Decreases This Quarter
We use the change in the portfolio allocation because this is the most meaningful metric. Changes can be due to trades or changes in share prices.
| Security | Shares (MM) |
Value (MM$) |
Portfolio % | ΔPortfolio % |
|---|---|---|---|---|
| 0.01 | 1.00 | 1.8459 | -12.6346 | |
| 0.00 | 0.00 | -5.4302 | ||
| 0.00 | 0.00 | -4.9647 | ||
| 0.00 | 0.00 | -3.4898 | ||
| 0.00 | 0.00 | -3.3098 | ||
| 0.00 | 0.00 | -2.5858 | ||
| 0.00 | 0.00 | -1.9031 | ||
| 0.00 | 0.00 | -1.7790 | ||
| 0.00 | 0.00 | -1.5204 | ||
| 0.05 | 0.91 | 1.6689 | -1.3100 |
13F and Fund Filings
This form was filed on 2017-02-09 for the reporting period 2016-12-31. Click the link icon to see the full transaction history.
Upgrade to unlock premium data and export to Excel ![]() .
.