Basic Stats
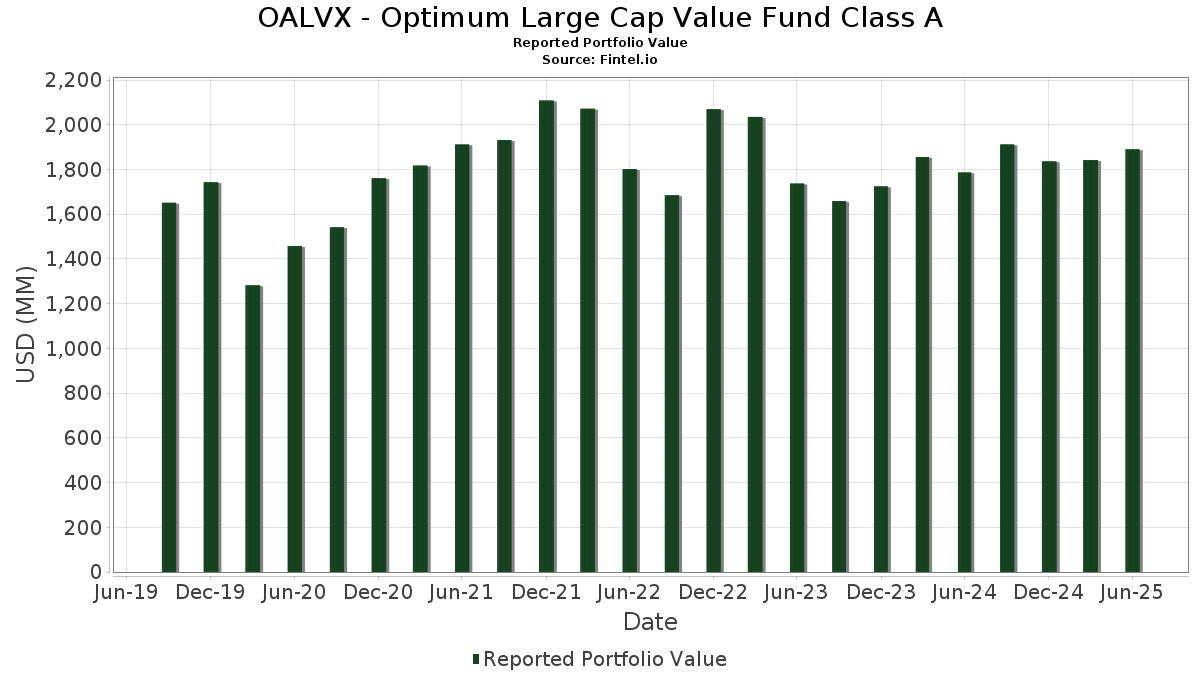
| Portfolio Value | $ 1,889,985,700 |
| Current Positions | 128 |
Latest Holdings, Performance, AUM (from 13F, 13D)
OALVX - Optimum Large Cap Value Fund Class A has disclosed 128 total holdings in their latest SEC filings. Most recent portfolio value is calculated to be $ 1,889,985,700 USD. Actual Assets Under Management (AUM) is this value plus cash (which is not disclosed). OALVX - Optimum Large Cap Value Fund Class A’s top holdings are JPMorgan Chase & Co. (US:JPM) , RTX Corporation (US:RTX) , The Progressive Corporation (US:PGR) , Exxon Mobil Corporation (US:XOM) , and Abbott Laboratories (US:ABT) . OALVX - Optimum Large Cap Value Fund Class A’s new positions include Amazon.com, Inc. (US:AMZN) , GE Vernova Inc. (US:GEV) , .
Top Increases This Quarter
We use the change in the portfolio allocation because this is the most meaningful metric. Changes can be due to trades or changes in share prices.
| Security | Shares (MM) |
Value (MM$) |
Portfolio % | ΔPortfolio % |
|---|---|---|---|---|
| 0.07 | 14.46 | 0.7647 | 0.7647 | |
| 0.02 | 9.99 | 0.5283 | 0.5283 | |
| 0.41 | 32.85 | 1.7380 | 0.3711 | |
| 0.29 | 84.48 | 4.4691 | 0.3535 | |
| 0.05 | 14.40 | 0.7617 | 0.2795 | |
| 0.08 | 14.01 | 0.7411 | 0.2425 | |
| 0.11 | 34.47 | 1.8237 | 0.2195 | |
| 0.13 | 17.02 | 0.9004 | 0.1965 | |
| 0.11 | 22.60 | 1.1954 | 0.1803 | |
| 0.03 | 33.43 | 1.7683 | 0.1791 |
Top Decreases This Quarter
We use the change in the portfolio allocation because this is the most meaningful metric. Changes can be due to trades or changes in share prices.
| Security | Shares (MM) |
Value (MM$) |
Portfolio % | ΔPortfolio % |
|---|---|---|---|---|
| 0.12 | 22.40 | 1.1848 | -0.5627 | |
| 0.04 | 13.09 | 0.6926 | -0.5192 | |
| 0.31 | 27.95 | 1.4787 | -0.3258 | |
| 0.34 | 36.97 | 1.9556 | -0.2940 | |
| 0.12 | 3.06 | 0.1621 | -0.2458 | |
| 0.14 | 38.69 | 2.0469 | -0.2177 | |
| 0.17 | 11.74 | 0.6210 | -0.2022 | |
| 0.19 | 28.36 | 1.5004 | -0.1984 | |
| 0.10 | 20.98 | 1.1101 | -0.1825 | |
| 0.14 | 18.62 | 0.9850 | -0.1813 |
13F and Fund Filings
This form was filed on 2025-08-27 for the reporting period 2025-06-30. Click the link icon to see the full transaction history.
Upgrade to unlock premium data and export to Excel ![]() .
.
| Security | Type | Avg Share Price | Shares (MM) |
ΔShares (%) |
ΔShares (%) |
Value ($MM) |
Portfolio (%) |
ΔPortfolio (%) |
|
|---|---|---|---|---|---|---|---|---|---|
| JPM / JPMorgan Chase & Co. | 0.29 | -5.70 | 84.48 | 11.44 | 4.4691 | 0.3535 | |||
| RTX / RTX Corporation | 0.29 | -1.58 | 42.30 | 8.50 | 2.2376 | 0.1211 | |||
| PGR / The Progressive Corporation | 0.14 | -1.62 | 38.69 | -7.24 | 2.0469 | -0.2177 | |||
| XOM / Exxon Mobil Corporation | 0.34 | -1.57 | 36.97 | -10.78 | 1.9556 | -0.2940 | |||
| ABT / Abbott Laboratories | 0.26 | -1.56 | 35.10 | 0.93 | 1.8568 | -0.0313 | |||
| AXP / American Express Company | 0.11 | -1.59 | 34.47 | 16.68 | 1.8237 | 0.2195 | |||
| BLK / BlackRock, Inc. | 0.03 | 3.01 | 33.43 | 14.20 | 1.7683 | 0.1791 | |||
| WFC / Wells Fargo & Company | 0.41 | 16.93 | 32.85 | 30.49 | 1.7380 | 0.3711 | |||
| HON / Honeywell International Inc. | 0.14 | -1.57 | 32.43 | 8.25 | 1.7158 | 0.0891 | |||
| LOW / Lowe's Companies, Inc. | 0.14 | 4.71 | 31.95 | -0.39 | 1.6901 | -0.0513 | |||
| DUK / Duke Energy Corporation | 0.27 | -1.58 | 31.59 | -4.79 | 1.6711 | -0.1302 | |||
| TRV / The Travelers Companies, Inc. | 0.12 | -1.58 | 31.13 | -0.43 | 1.6468 | -0.0506 | |||
| CI / The Cigna Group | 0.09 | -1.62 | 30.23 | -1.15 | 1.5993 | -0.0611 | |||
| MCK / McKesson Corporation | 0.04 | -11.11 | 28.42 | -3.21 | 1.5034 | -0.0907 | |||
| JNJ / Johnson & Johnson | 0.19 | -1.59 | 28.36 | -9.35 | 1.5004 | -0.1984 | |||
| COP / ConocoPhillips | 0.31 | -1.58 | 27.95 | -15.90 | 1.4787 | -0.3258 | |||
| MDLZ / Mondelez International, Inc. | 0.36 | -1.57 | 24.23 | -2.16 | 1.2816 | -0.0627 | |||
| PLD / Prologis, Inc. | 0.22 | 5.09 | 23.47 | -1.18 | 1.2416 | -0.0479 | |||
| BA / The Boeing Company | 0.11 | -1.62 | 22.60 | 20.86 | 1.1954 | 0.1803 | |||
| ABBV / AbbVie Inc. | 0.12 | -21.46 | 22.40 | -30.42 | 1.1848 | -0.5627 | |||
| MS / Morgan Stanley | 0.15 | -6.27 | 21.04 | 13.17 | 1.1130 | 0.1036 | |||
| MMC / Marsh & McLennan Companies, Inc. | 0.10 | -1.62 | 20.98 | -11.86 | 1.1101 | -0.1825 | |||
| BSX / Boston Scientific Corporation | 0.19 | -1.52 | 20.22 | 4.85 | 1.0694 | 0.0226 | |||
| MRK / Merck & Co., Inc. | 0.25 | 38.90 | 20.00 | 22.49 | 1.0578 | 0.1715 | |||
| BAC / Bank of America Corporation | 0.41 | -1.52 | 19.50 | 11.67 | 1.0313 | 0.0835 | |||
| BRK.B / Berkshire Hathaway Inc. | 0.04 | -1.52 | 19.03 | -10.18 | 1.0069 | -0.1435 | |||
| PH / Parker-Hannifin Corporation | 0.03 | -1.52 | 18.92 | 13.15 | 1.0007 | 0.0931 | |||
| DIS / The Walt Disney Company | 0.15 | -1.52 | 18.78 | 23.73 | 0.9933 | 0.1694 | |||
| PEP / PepsiCo, Inc. | 0.14 | -1.58 | 18.62 | -13.33 | 0.9850 | -0.1813 | |||
| ADI / Analog Devices, Inc. | 0.08 | -1.62 | 18.29 | 16.11 | 0.9676 | 0.1123 | |||
| ICE / Intercontinental Exchange, Inc. | 0.10 | -1.52 | 18.19 | 4.74 | 0.9623 | 0.0194 | |||
| NDAQ / Nasdaq, Inc. | 0.20 | -1.62 | 18.18 | 15.97 | 0.9616 | 0.1106 | |||
| GD / General Dynamics Corporation | 0.06 | -1.62 | 18.01 | 5.26 | 0.9526 | 0.0238 | |||
| CSCO / Cisco Systems, Inc. | 0.26 | -1.52 | 17.80 | 10.71 | 0.9419 | 0.0688 | |||
| SO / The Southern Company | 0.19 | -1.62 | 17.23 | -1.75 | 0.9116 | -0.0406 | |||
| AON / Aon plc | 0.05 | -1.62 | 17.10 | -12.06 | 0.9045 | -0.1510 | |||
| EOG / EOG Resources, Inc. | 0.14 | -1.56 | 17.04 | -8.18 | 0.9014 | -0.1062 | |||
| KKR / KKR & Co. Inc. | 0.13 | 14.09 | 17.02 | 31.28 | 0.9004 | 0.1965 | |||
| HIG / The Hartford Insurance Group, Inc. | 0.13 | -1.52 | 16.93 | 0.98 | 0.8958 | -0.0147 | |||
| D / Dominion Energy, Inc. | 0.29 | 2.99 | 16.21 | 3.82 | 0.8573 | 0.0098 | |||
| ACN / Accenture plc | 0.05 | 9.57 | 16.13 | 4.94 | 0.8536 | 0.0189 | |||
| UNP / Union Pacific Corporation | 0.07 | -1.62 | 16.10 | -4.18 | 0.8518 | -0.0606 | |||
| CB / Chubb Limited | 0.06 | -1.62 | 16.03 | -5.62 | 0.8479 | -0.0741 | |||
| C / Citigroup Inc. | 0.19 | -1.62 | 15.80 | 17.96 | 0.8357 | 0.1086 | |||
| PNC / The PNC Financial Services Group, Inc. | 0.08 | -1.62 | 15.70 | 4.34 | 0.8307 | 0.0136 | |||
| META / Meta Platforms, Inc. | 0.02 | -1.52 | 14.66 | 26.11 | 0.7754 | 0.1444 | |||
| GILD / Gilead Sciences, Inc. | 0.13 | -1.52 | 14.58 | -2.56 | 0.7713 | -0.0411 | |||
| AMZN / Amazon.com, Inc. | 0.07 | 14.46 | 0.7647 | 0.7647 | |||||
| TXN / Texas Instruments Incorporated | 0.07 | -1.62 | 14.42 | 13.66 | 0.7627 | 0.0740 | |||
| AVGO / Broadcom Inc. | 0.05 | -1.52 | 14.40 | 62.13 | 0.7617 | 0.2795 | |||
| GS / The Goldman Sachs Group, Inc. | 0.02 | -1.52 | 14.08 | 27.58 | 0.7446 | 0.1456 | |||
| GOOGL / Alphabet Inc. | 0.08 | 33.85 | 14.01 | 52.54 | 0.7411 | 0.2425 | |||
| MSFT / Microsoft Corporation | 0.03 | -1.52 | 13.41 | 30.49 | 0.7096 | 0.1515 | |||
| ROK / Rockwell Automation, Inc. | 0.04 | -1.52 | 13.20 | 26.60 | 0.6982 | 0.1322 | |||
| UNH / UnitedHealth Group Incorporated | 0.04 | -1.52 | 13.09 | -41.34 | 0.6926 | -0.5192 | |||
| CARR / Carrier Global Corporation | 0.18 | -1.52 | 12.95 | 13.69 | 0.6849 | 0.0666 | |||
| PSA / Public Storage | 0.04 | -1.55 | 12.72 | -3.48 | 0.6728 | -0.0426 | |||
| KLAC / KLA Corporation | 0.01 | -1.62 | 12.71 | 29.63 | 0.6723 | 0.1400 | |||
| MU / Micron Technology, Inc. | 0.10 | -1.52 | 12.62 | 39.68 | 0.6674 | 0.1771 | |||
| MAR / Marriott International, Inc. | 0.05 | -1.62 | 12.48 | 12.84 | 0.6604 | 0.0597 | |||
| MSI / Motorola Solutions, Inc. | 0.03 | -1.52 | 12.33 | -5.42 | 0.6524 | -0.0556 | |||
| DRI / Darden Restaurants, Inc. | 0.06 | -1.52 | 12.27 | 3.32 | 0.6493 | 0.0043 | |||
| NXPI / NXP Semiconductors N.V. | 0.06 | 9.04 | 12.19 | 25.35 | 0.6447 | 0.1169 | |||
| PG / The Procter & Gamble Company | 0.08 | -1.52 | 12.17 | -7.94 | 0.6438 | -0.0739 | |||
| MLM / Martin Marietta Materials, Inc. | 0.02 | -1.52 | 12.16 | 13.07 | 0.6434 | 0.0594 | |||
| COR / Cencora, Inc. | 0.04 | -1.52 | 12.11 | 6.18 | 0.6407 | 0.0214 | |||
| PFE / Pfizer Inc. | 0.50 | -1.62 | 12.00 | -5.89 | 0.6350 | -0.0575 | |||
| DD / DuPont de Nemours, Inc. | 0.17 | -15.71 | 11.74 | -22.58 | 0.6210 | -0.2022 | |||
| CVX / Chevron Corporation | 0.08 | -1.62 | 11.63 | -15.80 | 0.6152 | -0.1346 | |||
| TJX / The TJX Companies, Inc. | 0.09 | 22.25 | 11.61 | 23.95 | 0.6140 | 0.1056 | |||
| SPGI / S&P Global Inc. | 0.02 | -1.52 | 11.59 | 2.20 | 0.6129 | -0.0026 | |||
| FOXA / Fox Corporation | 0.21 | -1.52 | 11.57 | -2.49 | 0.6122 | -0.0322 | |||
| AMT / American Tower Corporation | 0.05 | -1.52 | 11.55 | 0.03 | 0.6111 | -0.0159 | |||
| PWR / Quanta Services, Inc. | 0.03 | -35.15 | 11.43 | -3.54 | 0.6047 | -0.0386 | |||
| CSX / CSX Corporation | 0.35 | -1.52 | 11.36 | 9.19 | 0.6011 | 0.0361 | |||
| NEE / NextEra Energy, Inc. | 0.16 | -1.52 | 11.17 | -3.57 | 0.5908 | -0.0380 | |||
| DAL / Delta Air Lines, Inc. | 0.22 | -1.52 | 11.01 | 11.08 | 0.5822 | 0.0443 | |||
| NOC / Northrop Grumman Corporation | 0.02 | -1.62 | 10.78 | -3.93 | 0.5701 | -0.0389 | |||
| ELV / Elevance Health, Inc. | 0.03 | -1.62 | 10.73 | -12.03 | 0.5674 | -0.0945 | |||
| XEL / Xcel Energy Inc. | 0.16 | 24.23 | 10.70 | 19.51 | 0.5661 | 0.0799 | |||
| NESN / Nestlé S.A. | 0.11 | -13.85 | 10.55 | -15.25 | 0.5581 | -0.1177 | |||
| ETN / Eaton Corporation plc | 0.03 | -1.62 | 10.52 | 29.20 | 0.5564 | 0.1144 | |||
| TMO / Thermo Fisher Scientific Inc. | 0.03 | -1.52 | 10.36 | -19.76 | 0.5480 | -0.1529 | |||
| PCAR / PACCAR Inc | 0.11 | -1.62 | 10.25 | -3.96 | 0.5421 | -0.0372 | |||
| APD / Air Products and Chemicals, Inc. | 0.04 | -1.52 | 10.04 | -5.81 | 0.5309 | -0.0476 | |||
| GEV / GE Vernova Inc. | 0.02 | 9.99 | 0.5283 | 0.5283 | |||||
| SLB / Schlumberger Limited | 0.29 | -1.52 | 9.95 | -20.37 | 0.5264 | -0.1520 | |||
| PYPL / PayPal Holdings, Inc. | 0.13 | -1.52 | 9.91 | 12.16 | 0.5242 | 0.0446 | |||
| ITW / Illinois Tool Works Inc. | 0.04 | 13.38 | 9.84 | 13.05 | 0.5208 | 0.0479 | |||
| ORCL / Oracle Corporation | 0.05 | -31.26 | 9.84 | 7.49 | 0.5207 | 0.0235 | |||
| PCG / PG&E Corporation | 0.70 | -1.62 | 9.74 | -20.18 | 0.5155 | -0.1473 | |||
| TXT / Textron Inc. | 0.12 | -1.52 | 9.73 | 9.44 | 0.5147 | 0.0320 | |||
| FCX / Freeport-McMoRan Inc. | 0.22 | -1.52 | 9.49 | 12.75 | 0.5020 | 0.0451 | |||
| EFX / Equifax Inc. | 0.04 | -1.62 | 9.35 | 4.76 | 0.4948 | 0.0101 | |||
| VZ / Verizon Communications Inc. | 0.22 | -1.52 | 9.35 | -6.06 | 0.4947 | -0.0458 | |||
| GM / General Motors Company | 0.18 | -1.52 | 8.85 | 3.05 | 0.4682 | 0.0019 | |||
| CMCSA / Comcast Corporation | 0.25 | -1.52 | 8.83 | -4.76 | 0.4671 | -0.0362 | |||
| OC / Owens Corning | 0.06 | -1.52 | 8.72 | -5.18 | 0.4615 | -0.0380 | |||
| BDX / Becton, Dickinson and Company | 0.05 | -1.52 | 8.68 | -25.95 | 0.4590 | -0.1771 | |||
| AMGN / Amgen Inc. | 0.03 | -1.52 | 8.15 | -11.74 | 0.4309 | -0.0702 | |||
| KVUE / Kenvue Inc. | 0.38 | -12.14 | 7.85 | -23.32 | 0.4153 | -0.1405 | |||
| EXE / Expand Energy Corporation | 0.07 | 42.32 | 7.84 | 49.51 | 0.4149 | 0.1301 | |||
| EXC / Exelon Corporation | 0.16 | -1.62 | 6.76 | -7.30 | 0.3575 | -0.0383 | |||
| FIGXX / Fidelity Colchester Street Trust - Fidelity Institutional Money Market Funds Government Portfolio Class I | 6.72 | 24.17 | 6.72 | 24.16 | 0.3556 | 0.0617 | |||
| TFDXX / Blackrock Liquidity Funds - BlackRock Liquidity Funds FedFund Portfolio Institutional Class | 6.72 | 24.17 | 6.72 | 24.16 | 0.3556 | 0.0617 | |||
| GSAXX / Goldman Sachs Trust - Goldman Sachs Financial Square Government Fund | 6.72 | 24.17 | 6.72 | 24.16 | 0.3556 | 0.0617 | |||
| US61747C7074 / Morgan Stanley Institutional Liquidity Funds Government Portfolio, Institutional Class | 6.72 | 24.17 | 6.72 | 24.16 | 0.3556 | 0.0617 | |||
| PSX / Phillips 66 | 0.05 | -1.52 | 6.50 | -4.86 | 0.3441 | -0.0271 | |||
| KMB / Kimberly-Clark Corporation | 0.05 | -1.62 | 6.02 | -10.83 | 0.3187 | -0.0481 | |||
| RKT / Reckitt Benckiser Group plc | 0.08 | -1.62 | 5.67 | -0.94 | 0.2997 | -0.0109 | |||
| TGT / Target Corporation | 0.06 | -16.33 | 5.62 | -20.90 | 0.2973 | -0.0885 | |||
| CRH / CRH plc | 0.06 | 43.70 | 5.57 | 49.99 | 0.2946 | 0.0930 | |||
| TSN / Tyson Foods, Inc. | 0.10 | -1.52 | 5.37 | -13.68 | 0.2842 | -0.0536 | |||
| ELS / Equity LifeStyle Properties, Inc. | 0.08 | -1.52 | 5.15 | -8.95 | 0.2724 | -0.0346 | |||
| PRU / Prudential Financial, Inc. | 0.05 | -1.52 | 5.03 | -5.25 | 0.2662 | -0.0222 | |||
| STT / State Street Corporation | 0.05 | -1.52 | 4.90 | 16.96 | 0.2594 | 0.0318 | |||
| AEP / American Electric Power Company, Inc. | 0.04 | -1.62 | 4.14 | -6.59 | 0.2191 | -0.0216 | |||
| SHW / The Sherwin-Williams Company | 0.01 | -1.62 | 3.99 | -3.25 | 0.2109 | -0.0128 | |||
| CNI / Canadian National Railway Company | 0.04 | -1.62 | 3.87 | 5.02 | 0.2048 | 0.0047 | |||
| TFC / Truist Financial Corporation | 0.09 | -1.52 | 3.77 | 2.90 | 0.1992 | 0.0005 | |||
| AVTR / Avantor, Inc. | 0.26 | -1.52 | 3.49 | -18.24 | 0.1846 | -0.0471 | |||
| ON / ON Semiconductor Corporation | 0.07 | -1.52 | 3.49 | 26.84 | 0.1846 | 0.0352 | |||
| GWW / W.W. Grainger, Inc. | 0.00 | -1.63 | 3.39 | 3.61 | 0.1793 | 0.0017 | |||
| CTVA / Corteva, Inc. | 0.04 | -48.35 | 3.23 | -38.82 | 0.1708 | -0.1157 | |||
| DGE / Diageo plc | 0.12 | -57.71 | 3.06 | -59.23 | 0.1621 | -0.2458 | |||
| TT / Trane Technologies plc | 0.01 | -1.62 | 2.98 | 27.74 | 0.1574 | 0.0309 | |||
| OTIS / Otis Worldwide Corporation | 0.03 | -1.62 | 2.96 | -5.61 | 0.1567 | -0.0137 | |||
| CDW / CDW Corporation | 0.01 | 40.52 | 2.53 | 56.60 | 0.1337 | 0.0461 |