Basic Stats
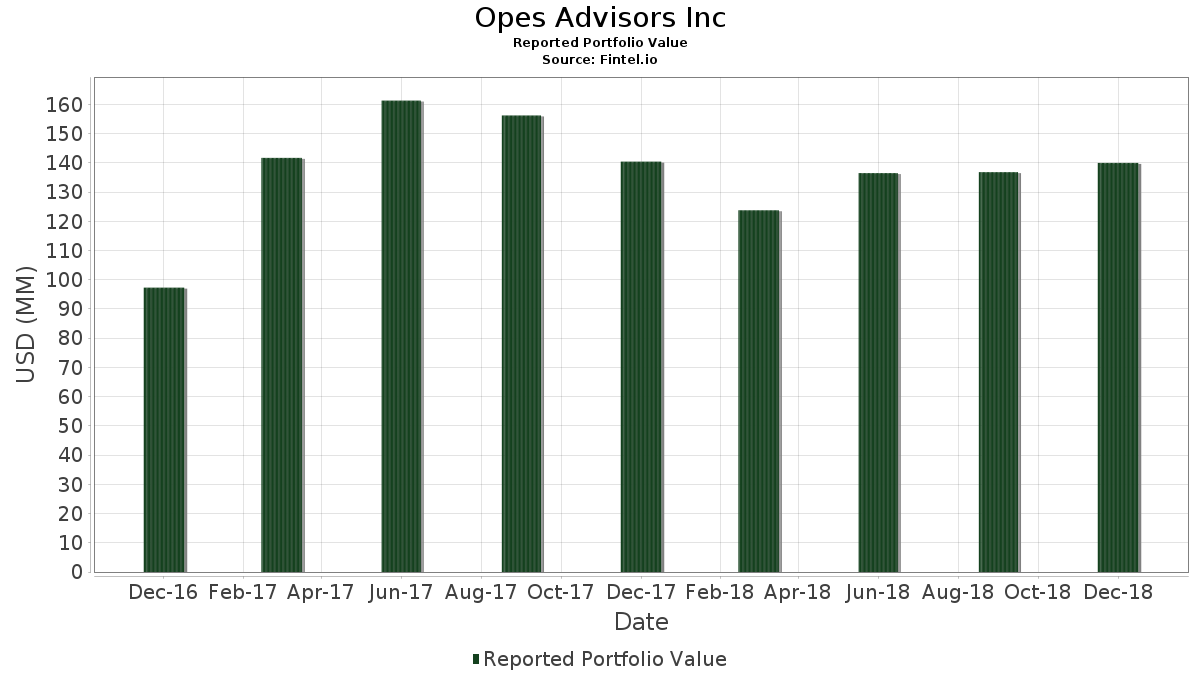
| Portfolio Value | $ 139,976,000 |
| Current Positions | 43 |
Latest Holdings, Performance, AUM (from 13F, 13D)
Opes Advisors Inc has disclosed 43 total holdings in their latest SEC filings. Most recent portfolio value is calculated to be $ 139,976,000 USD. Actual Assets Under Management (AUM) is this value plus cash (which is not disclosed). Opes Advisors Inc’s top holdings are Schwab Strategic Trust - Schwab U.S. Aggregate Bond ETF (US:SCHZ) , Schwab Strategic Trust - Schwab Fundamental International Equity ETF (US:FNDF) , SPDR Series Trust - SPDR Bloomberg International Treasury Bond ETF (US:BWX) , Schwab Strategic Trust - Schwab U.S. Large-Cap Growth ETF (US:SCHG) , and Schwab Strategic Trust - Schwab Fundamental U.S. Broad Market ETF (US:FNDB) . Opes Advisors Inc’s new positions include J.P. Morgan Exchange-Traded Fund Trust - JPMorgan Diversified Return Emerging Markets Equity ETF (US:JPEM) , JPMorgan Diversified Return Global Equity ETF (US:JPGE) , Schwab Strategic Trust - Schwab International Small-Cap Equity ETF (US:SCHC) , PIMCO ETF Trust - PIMCO Active Bond Exchange-Traded Fund (US:BOND) , and WisdomTree Trust - WisdomTree PutWrite Strategy Fund (US:PUTW) .
Top Increases This Quarter
We use the change in the portfolio allocation because this is the most meaningful metric. Changes can be due to trades or changes in share prices.
| Security | Shares (MM) |
Value (MM$) |
Portfolio % | ΔPortfolio % |
|---|---|---|---|---|
| 0.28 | 14.25 | 10.1832 | 10.1832 | |
| 0.55 | 13.96 | 9.9753 | 9.9753 | |
| 0.43 | 11.89 | 8.4929 | 8.4929 | |
| 0.14 | 9.38 | 6.6990 | 6.6990 | |
| 0.27 | 9.12 | 6.5125 | 6.5125 | |
| 0.17 | 8.45 | 6.0353 | 6.0353 | |
| 0.26 | 7.28 | 5.2037 | 5.2037 | |
| 0.11 | 6.31 | 4.5065 | 4.5065 | |
| 0.22 | 6.24 | 4.4550 | 4.4550 | |
| 0.04 | 4.99 | 3.5635 | 3.5635 |
Top Decreases This Quarter
We use the change in the portfolio allocation because this is the most meaningful metric. Changes can be due to trades or changes in share prices.
| Security | Shares (MM) |
Value (MM$) |
Portfolio % | ΔPortfolio % |
|---|---|---|---|---|
| 0.00 | 0.00 | -0.2704 | ||
| 0.00 | 0.45 | 0.3201 | -0.1872 | |
| 0.00 | 0.00 | -0.1769 | ||
| 0.00 | 0.00 | -0.1718 | ||
| 0.00 | 0.00 | -0.1630 | ||
| 0.00 | 0.22 | 0.1579 | -0.1301 | |
| 0.00 | 0.27 | 0.1929 | -0.1126 | |
| 0.00 | 0.40 | 0.2829 | -0.0920 | |
| 0.00 | 0.35 | 0.2508 | -0.0452 |
13F and Fund Filings
This form was filed on 2019-02-08 for the reporting period 2018-12-31. Click the link icon to see the full transaction history.
Upgrade to unlock premium data and export to Excel ![]() .
.