Basic Stats
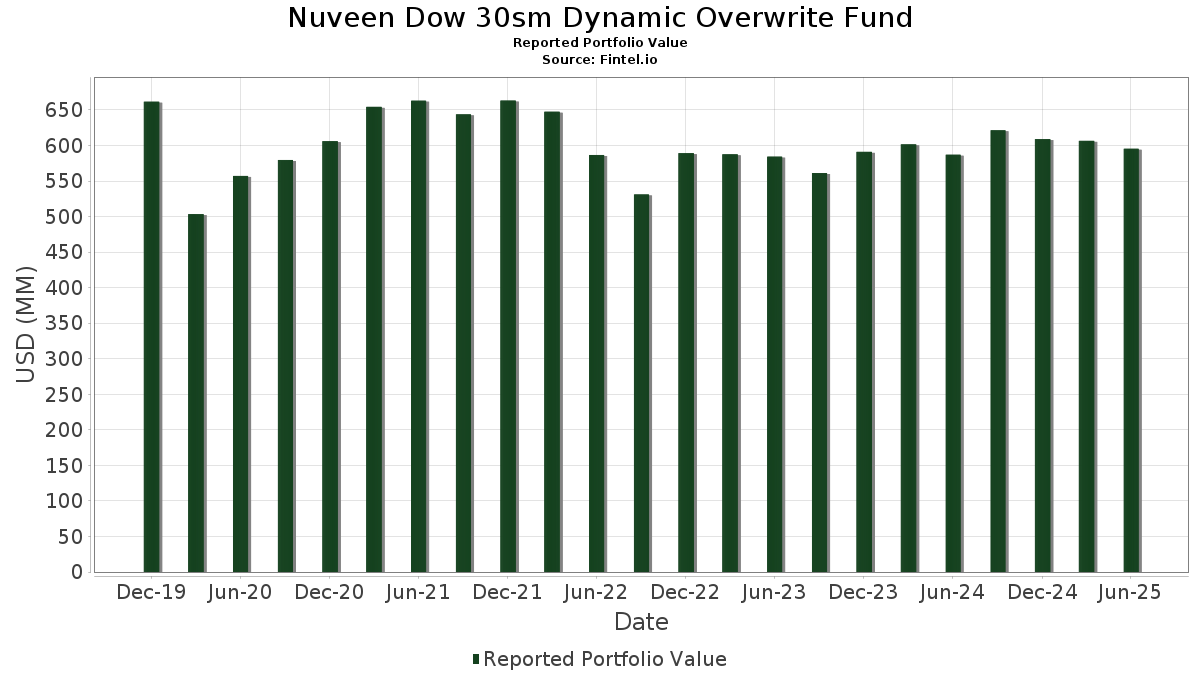
| Portfolio Value | $ 595,367,747 |
| Current Positions | 37 |
Latest Holdings, Performance, AUM (from 13F, 13D)
Nuveen Dow 30sm Dynamic Overwrite Fund has disclosed 37 total holdings in their latest SEC filings. Most recent portfolio value is calculated to be $ 595,367,747 USD. Actual Assets Under Management (AUM) is this value plus cash (which is not disclosed). Nuveen Dow 30sm Dynamic Overwrite Fund’s top holdings are The Goldman Sachs Group, Inc. (US:GS) , Microsoft Corporation (US:MSFT) , Caterpillar Inc. (US:CAT) , The Home Depot, Inc. (US:HD) , and Visa Inc. (US:V) . Nuveen Dow 30sm Dynamic Overwrite Fund’s new positions include Dreyfus Institutional Preferred Government Plus Money Market Fund (US:US85748R0096) , .
Top Increases This Quarter
We use the change in the portfolio allocation because this is the most meaningful metric. Changes can be due to trades or changes in share prices.
| Security | Shares (MM) |
Value (MM$) |
Portfolio % | ΔPortfolio % |
|---|---|---|---|---|
| 0.08 | 57.87 | 9.9006 | 2.0107 | |
| 0.08 | 40.67 | 6.9582 | 1.5365 | |
| 0.08 | 31.74 | 5.4306 | 0.6674 | |
| 0.08 | 12.92 | 2.2101 | 0.6448 | |
| 0.08 | 26.08 | 4.4622 | 0.5763 | |
| 0.08 | 24.10 | 4.1236 | 0.5323 | |
| 0.08 | 23.70 | 4.0555 | 0.5127 | |
| 0.08 | 17.13 | 2.9311 | 0.4679 | |
| 0.04 | 11.97 | 2.0489 | 0.4379 | |
| 0.08 | 17.94 | 3.0690 | 0.3211 |
Top Decreases This Quarter
We use the change in the portfolio allocation because this is the most meaningful metric. Changes can be due to trades or changes in share prices.
| Security | Shares (MM) |
Value (MM$) |
Portfolio % | ΔPortfolio % |
|---|---|---|---|---|
| 0.08 | 25.51 | 4.3641 | -3.2003 | |
| -9.65 | -1.6513 | -1.6513 | ||
| 0.08 | 22.83 | 3.9058 | -0.5938 | |
| 8.42 | 1.4400 | -0.4553 | ||
| 0.08 | 23.89 | 4.0871 | -0.4244 | |
| 0.08 | 11.71 | 2.0031 | -0.4131 | |
| 0.08 | 16.77 | 2.8701 | -0.3381 | |
| 0.08 | 12.49 | 2.1368 | -0.2584 | |
| 0.08 | 28.07 | 4.8032 | -0.2400 | |
| 0.08 | 13.03 | 2.2287 | -0.2326 |
13F and Fund Filings
This form was filed on 2025-08-27 for the reporting period 2025-06-30. Click the link icon to see the full transaction history.
Upgrade to unlock premium data and export to Excel ![]() .
.
| Security | Type | Avg Share Price | Shares (MM) |
ΔShares (%) |
ΔShares (%) |
Value ($MM) |
Portfolio (%) |
ΔPortfolio (%) |
|
|---|---|---|---|---|---|---|---|---|---|
| GS / The Goldman Sachs Group, Inc. | 0.08 | -4.93 | 57.87 | 23.17 | 9.9006 | 2.0107 | |||
| MSFT / Microsoft Corporation | 0.08 | -4.93 | 40.67 | 25.98 | 6.9582 | 1.5365 | |||
| CAT / Caterpillar Inc. | 0.08 | -4.93 | 31.74 | 11.91 | 5.4306 | 0.6674 | |||
| HD / The Home Depot, Inc. | 0.08 | -4.93 | 29.98 | -4.89 | 5.1289 | -0.1642 | |||
| V / Visa Inc. | 0.08 | -4.93 | 29.03 | -3.68 | 4.9668 | -0.0949 | |||
| SHW / The Sherwin-Williams Company | 0.08 | -4.93 | 28.07 | -6.51 | 4.8032 | -0.2400 | |||
| AXP / American Express Company | 0.08 | -4.93 | 26.08 | 12.72 | 4.4622 | 0.5763 | |||
| UNH / UnitedHealth Group Incorporated | 0.08 | -4.93 | 25.51 | -43.37 | 4.3641 | -3.2003 | |||
| IBM / International Business Machines Corporation | 0.08 | -4.93 | 24.10 | 12.71 | 4.1236 | 0.5323 | |||
| MCD / McDonald's Corporation | 0.08 | -4.93 | 23.89 | -11.08 | 4.0871 | -0.4244 | |||
| JPM / JPMorgan Chase & Co. | 0.08 | -4.93 | 23.70 | 12.37 | 4.0555 | 0.5127 | |||
| AMGN / Amgen Inc. | 0.08 | -4.93 | 22.83 | -14.80 | 3.9058 | -0.5938 | |||
| CRM / Salesforce, Inc. | 0.08 | -4.93 | 22.30 | -3.39 | 3.8146 | -0.0612 | |||
| TRV / The Travelers Companies, Inc. | 0.08 | -4.93 | 21.87 | -3.82 | 3.7426 | -0.0769 | |||
| HON / Honeywell International Inc. | 0.08 | -4.93 | 19.04 | 4.56 | 3.2577 | 0.1995 | |||
| AMZN / Amazon.com, Inc. | 0.08 | -4.93 | 17.94 | 9.63 | 3.0690 | 0.3211 | |||
| BA / The Boeing Company | 0.08 | -4.93 | 17.13 | 16.81 | 2.9311 | 0.4679 | |||
| AAPL / Apple Inc. | 0.08 | -4.93 | 16.77 | -12.19 | 2.8701 | -0.3381 | |||
| PG / The Procter & Gamble Company | 0.08 | -4.93 | 13.03 | -11.12 | 2.2287 | -0.2326 | |||
| NVDA / NVIDIA Corporation | 0.08 | -4.93 | 12.92 | 38.59 | 2.2101 | 0.6448 | |||
| JNJ / Johnson & Johnson | 0.08 | -4.93 | 12.49 | -12.43 | 2.1368 | -0.2584 | |||
| MMM / 3M Company | 0.08 | -4.93 | 12.45 | -1.44 | 2.1297 | 0.0086 | |||
| VTI / Vanguard Index Funds - Vanguard Total Stock Market ETF | 0.04 | 12.89 | 11.97 | 24.85 | 2.0489 | 0.4379 | |||
| CVX / Chevron Corporation | 0.08 | -4.93 | 11.71 | -18.62 | 2.0031 | -0.4131 | |||
| DIS / The Walt Disney Company | 0.08 | -4.93 | 10.14 | 19.47 | 1.7348 | 0.3093 | |||
| US85748R0096 / Dreyfus Institutional Preferred Government Plus Money Market Fund | 8.42 | -25.42 | 1.4400 | -0.4553 | |||||
| WMT / Walmart Inc. | 0.08 | -4.93 | 7.99 | 5.89 | 1.3678 | 0.0999 | |||
| MRK / Merck & Co., Inc. | 0.08 | -4.93 | 6.47 | -16.15 | 1.1074 | -0.1890 | |||
| NKE / NIKE, Inc. | 0.08 | -4.93 | 5.81 | 6.39 | 0.9938 | 0.0769 | |||
| KO / The Coca-Cola Company | 0.08 | -4.93 | 5.78 | -6.09 | 0.9897 | -0.0447 | |||
| CSCO / Cisco Systems, Inc. | 0.08 | -4.93 | 5.67 | 6.90 | 0.9705 | 0.0793 | |||
| VZ / Verizon Communications Inc. | 0.08 | -4.93 | 3.54 | -9.31 | 0.6053 | -0.0498 | |||
| MU / Micron Technology, Inc. - Depositary Receipt (Common Stock) | 0.00 | 0.0007 | 0.0007 | ||||||
| US8575093013 / State Street Navigator Securities Lending Government Money Market Portfolio | 0.00 | -100.00 | 0.00 | -100.00 | 0.0000 | -0.1545 | |||
| S&P 500 Index / DE (N/A) | -0.29 | -0.0500 | -0.0500 | ||||||
| S&P 500 Index / DE (N/A) | -0.41 | -0.0702 | -0.0702 | ||||||
| S&P 500 Index / DE (N/A) | -1.18 | -0.2019 | -0.2019 | ||||||
| S&P 500 Index / DE (N/A) | -9.65 | -1.6513 | -1.6513 |