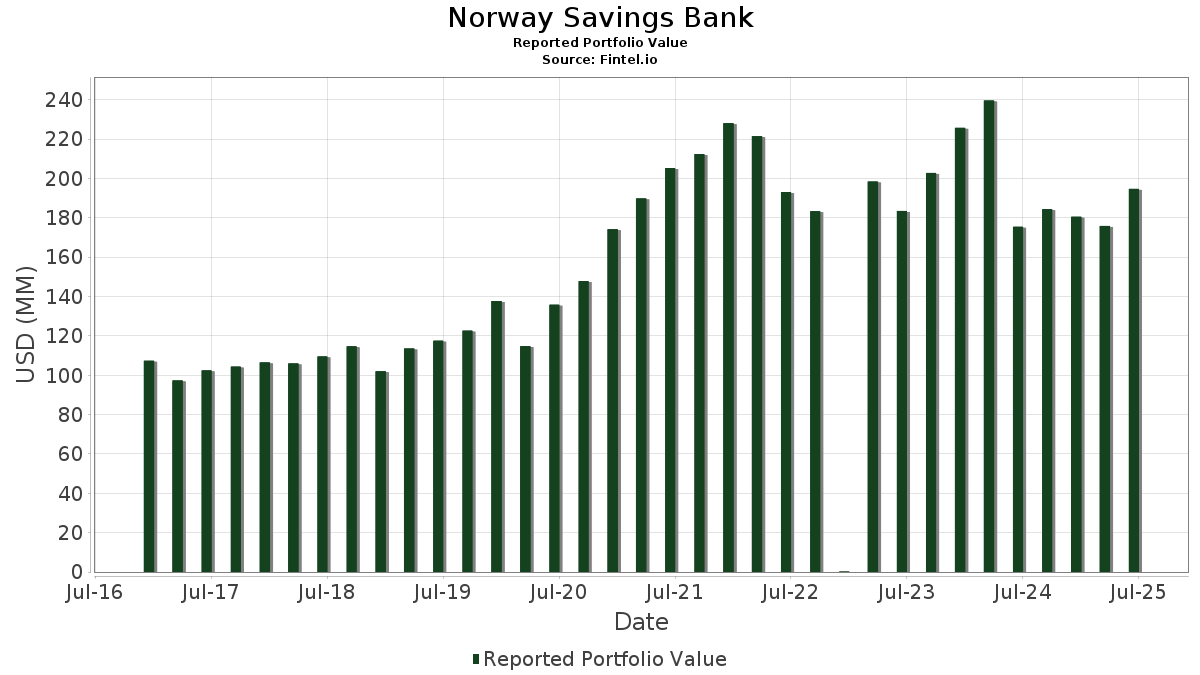
Basic Stats
| Portfolio Value | $ 194,699,403 |
| Current Positions | 103 |
Latest Holdings, Performance, AUM (from 13F, 13D)
Norway Savings Bank has disclosed 103 total holdings in their latest SEC filings. Most recent portfolio value is calculated to be $ 194,699,403 USD. Actual Assets Under Management (AUM) is this value plus cash (which is not disclosed). Norway Savings Bank’s top holdings are Microsoft Corporation (US:MSFT) , Apple Inc. (US:AAPL) , NVIDIA Corporation (US:NVDA) , Alphabet Inc. (US:GOOGL) , and Amazon.com, Inc. (US:AMZN) . Norway Savings Bank’s new positions include Marvell Technology, Inc. (US:MRVL) , .
Top Increases This Quarter
We use the change in the portfolio allocation because this is the most meaningful metric. Changes can be due to trades or changes in share prices.
| Security | Shares (MM) |
Value (MM$) |
Portfolio % | ΔPortfolio % |
|---|---|---|---|---|
| 0.02 | 9.34 | 4.7989 | 0.9503 | |
| 0.03 | 6.18 | 3.1727 | 0.8832 | |
| 0.01 | 0.76 | 0.3906 | 0.3906 | |
| 0.01 | 1.87 | 0.9618 | 0.3276 | |
| 0.04 | 6.52 | 3.3506 | 0.2849 | |
| 0.01 | 2.10 | 1.0776 | 0.2799 | |
| 0.00 | 1.42 | 0.7293 | 0.2497 | |
| 0.03 | 2.32 | 1.1908 | 0.2365 | |
| 0.02 | 6.35 | 3.2639 | 0.1810 | |
| 0.03 | 5.92 | 3.0403 | 0.1734 |
Top Decreases This Quarter
We use the change in the portfolio allocation because this is the most meaningful metric. Changes can be due to trades or changes in share prices.
| Security | Shares (MM) |
Value (MM$) |
Portfolio % | ΔPortfolio % |
|---|---|---|---|---|
| 0.01 | 4.33 | 1.1852 | -1.5539 | |
| 0.03 | 4.46 | 1.2187 | -1.3179 | |
| 0.00 | 3.78 | 1.0326 | -1.3024 | |
| 0.03 | 6.50 | 1.7768 | -1.2576 | |
| 0.02 | 3.07 | 0.8388 | -1.0897 | |
| 0.08 | 4.97 | 1.3607 | -1.0591 | |
| 0.04 | 8.66 | 4.4498 | -1.0435 | |
| 0.10 | 4.09 | 1.1179 | -1.0393 | |
| 0.05 | 7.52 | 2.0573 | -0.9024 | |
| 0.02 | 2.35 | 0.6430 | -0.8685 |
13F and Fund Filings
This form was filed on 2025-07-02 for the reporting period 2025-06-30. Click the link icon to see the full transaction history.
Upgrade to unlock premium data and export to Excel ![]() .
.
| Security | Type | Avg Share Price | Shares (MM) |
ΔShares (%) |
ΔShares (%) |
Value ($MM) |
Portfolio (%) |
ΔPortfolio (%) |
|
|---|---|---|---|---|---|---|---|---|---|
| MSFT / Microsoft Corporation | 0.02 | 4.18 | 9.34 | 38.05 | 4.7989 | 0.9503 | |||
| AAPL / Apple Inc. | 0.04 | -2.91 | 8.66 | -10.32 | 4.4498 | -1.0435 | |||
| NVDA / NVIDIA Corporation | 0.05 | -0.87 | 7.52 | 44.50 | 2.0573 | -0.9024 | |||
| GOOGL / Alphabet Inc. | 0.04 | 6.17 | 6.52 | 21.00 | 3.3506 | 0.2849 | |||
| AMZN / Amazon.com, Inc. | 0.03 | 5.57 | 6.50 | 21.74 | 1.7768 | -1.2576 | |||
| JPM / JPMorgan Chase & Co. | 0.02 | -0.83 | 6.35 | 17.21 | 3.2639 | 0.1810 | |||
| ORCL / Oracle Corporation | 0.03 | -1.89 | 6.18 | 53.43 | 3.1727 | 0.8832 | |||
| PANW / Palo Alto Networks, Inc. | 0.03 | -2.10 | 5.92 | 17.42 | 3.0403 | 0.1734 | |||
| EMXC / iShares, Inc. - iShares MSCI Emerging Markets ex China ETF | 0.08 | 2.00 | 4.97 | 16.90 | 1.3607 | -1.0591 | |||
| APH / Amphenol Corporation | 0.05 | -3.56 | 4.95 | 45.18 | 1.3527 | -0.5841 | |||
| ABT / Abbott Laboratories | 0.03 | -2.59 | 4.46 | -0.13 | 1.2187 | -1.3179 | |||
| BRK.B / Berkshire Hathaway Inc. | 0.01 | -1.38 | 4.33 | -10.05 | 1.1852 | -1.5539 | |||
| SPDW / SPDR Index Shares Funds - SPDR Portfolio Developed World ex-US ETF | 0.10 | -3.13 | 4.09 | 7.72 | 1.1179 | -1.0393 | |||
| LLY / Eli Lilly and Company | 0.00 | -2.59 | 3.78 | -8.06 | 1.0326 | -1.3024 | |||
| COST / Costco Wholesale Corporation | 0.00 | 2.92 | 3.76 | 7.73 | 1.9326 | -0.0534 | |||
| META / Meta Platforms, Inc. | 0.01 | 15.27 | 3.71 | 47.61 | 1.0151 | -0.4145 | |||
| ADI / Analog Devices, Inc. | 0.01 | 0.26 | 3.16 | 18.34 | 1.6205 | 0.1045 | |||
| CVX / Chevron Corporation | 0.02 | -4.70 | 3.08 | -18.42 | 1.5836 | -0.5658 | |||
| GJR / Strats Trust For Procter & Gambel Security - Preferred Security | 0.02 | -3.28 | 3.07 | -9.58 | 0.8388 | -1.0897 | |||
| CRM / Salesforce, Inc. | 0.01 | 10.32 | 2.96 | 12.07 | 1.5213 | 0.0189 | |||
| XOM / Exxon Mobil Corporation | 0.03 | -1.91 | 2.95 | -11.11 | 1.5172 | -0.3719 | |||
| ICE / Intercontinental Exchange, Inc. | 0.02 | 2.48 | 2.95 | 8.99 | 0.8058 | -0.7312 | |||
| DGRO / iShares Trust - iShares Core Dividend Growth ETF | 0.04 | 20.82 | 2.81 | 25.07 | 1.4431 | 0.1655 | |||
| BLK / BlackRock, Inc. | 0.00 | 8.48 | 2.75 | 20.29 | 0.7525 | -0.5483 | |||
| TYL / Tyler Technologies, Inc. | 0.00 | 1.23 | 2.54 | 3.21 | 1.3044 | -0.0946 | |||
| JNJ / Johnson & Johnson | 0.02 | -3.99 | 2.35 | -11.59 | 0.6430 | -0.8685 | |||
| MCHP / Microchip Technology Incorporated | 0.03 | -4.96 | 2.32 | 38.14 | 1.1908 | 0.2365 | |||
| HON / Honeywell International Inc. | 0.01 | 4.69 | 2.24 | 15.15 | 0.6133 | -0.4941 | |||
| BX / Blackstone Inc. | 0.01 | 6.14 | 2.21 | 13.60 | 0.6054 | -0.5027 | |||
| GS / The Goldman Sachs Group, Inc. | 0.00 | 5.69 | 2.16 | 36.95 | 0.5900 | -0.3058 | |||
| AMD / Advanced Micro Devices, Inc. | 0.01 | 8.27 | 2.10 | 49.54 | 1.0776 | 0.2799 | |||
| BA / The Boeing Company | 0.01 | 11.69 | 2.06 | 37.27 | 0.5632 | -0.2901 | |||
| LOW / Lowe's Companies, Inc. | 0.01 | 2.66 | 2.03 | -2.36 | 1.0420 | -0.1392 | |||
| IDXX / IDEXX Laboratories, Inc. | 0.00 | 8.55 | 2.00 | 38.67 | 0.5475 | -0.2735 | |||
| ZS / Zscaler, Inc. | 0.01 | 6.12 | 1.87 | 67.89 | 0.9618 | 0.3276 | |||
| DLR / Digital Realty Trust, Inc. | 0.01 | 10.06 | 1.83 | 33.92 | 0.5013 | -0.2770 | |||
| CAT / Caterpillar Inc. | 0.00 | 2.88 | 1.78 | 21.16 | 0.4856 | -0.3480 | |||
| KLAC / KLA Corporation | 0.00 | -1.26 | 1.76 | 30.15 | 0.4807 | -0.2874 | |||
| COP / ConocoPhillips | 0.02 | 1.80 | 1.75 | -13.01 | 0.4773 | -0.6634 | |||
| NEE / NextEra Energy, Inc. | 0.02 | -0.02 | 1.67 | -2.11 | 0.8596 | -0.1124 | |||
| TJX / The TJX Companies, Inc. | 0.01 | -1.92 | 1.57 | -0.57 | 0.4304 | -0.4694 | |||
| PEP / PepsiCo, Inc. | 0.01 | 0.43 | 1.53 | -11.59 | 0.7842 | -0.1975 | |||
| KO / The Coca-Cola Company | 0.02 | -0.39 | 1.52 | -1.62 | 0.4159 | -0.4628 | |||
| MMC / Marsh & McLennan Companies, Inc. | 0.01 | -0.93 | 1.51 | -11.26 | 0.4122 | -0.5532 | |||
| HCA / HCA Healthcare, Inc. | 0.00 | 14.75 | 1.49 | 27.23 | 0.4067 | -0.2578 | |||
| DUK / Duke Energy Corporation | 0.01 | -10.68 | 1.48 | -13.59 | 0.4036 | -0.5673 | |||
| JCI / Johnson Controls International plc | 0.01 | -2.24 | 1.44 | 28.93 | 0.7419 | 0.1047 | |||
| ISRG / Intuitive Surgical, Inc. | 0.00 | 53.44 | 1.42 | 68.33 | 0.7293 | 0.2497 | |||
| ADBE / Adobe Inc. | 0.00 | 23.14 | 1.40 | 24.22 | 0.7169 | 0.0780 | |||
| DHR / Danaher Corporation | 0.01 | 7.74 | 1.39 | 3.81 | 0.3806 | -0.3816 | |||
| CMG / Chipotle Mexican Grill, Inc. | 0.02 | -2.14 | 1.26 | 9.49 | 0.3438 | -0.3093 | |||
| AMGN / Amgen Inc. | 0.00 | 13.72 | 1.26 | 1.87 | 0.3437 | -0.3574 | |||
| ACN / Accenture plc | 0.00 | 0.88 | 1.23 | -3.37 | 0.6329 | -0.0922 | |||
| ZBRA / Zebra Technologies Corporation | 0.00 | 20.07 | 1.22 | 31.15 | 0.3340 | -0.1959 | |||
| MCD / McDonald's Corporation | 0.00 | -2.87 | 1.19 | -9.19 | 0.3246 | -0.4182 | |||
| EOG / EOG Resources, Inc. | 0.01 | 7.94 | 1.18 | 0.68 | 0.3230 | -0.3439 | |||
| GD / General Dynamics Corporation | 0.00 | -4.19 | 1.16 | 2.47 | 0.5967 | -0.0476 | |||
| MDLZ / Mondelez International, Inc. | 0.02 | -26.33 | 1.09 | -26.77 | 0.5621 | -0.2877 | |||
| V / Visa Inc. | 0.00 | 1.41 | 1.09 | 2.72 | 0.2993 | -0.3063 | |||
| BDX / Becton, Dickinson and Company | 0.01 | 16.63 | 1.05 | -12.31 | 0.2884 | -0.3952 | |||
| CI / The Cigna Group | 0.00 | 0.00 | 1.05 | 0.48 | 0.2871 | -0.3069 | |||
| SBUX / Starbucks Corporation | 0.01 | 10.09 | 1.01 | 2.85 | 0.2764 | -0.2823 | |||
| MTB / M&T Bank Corporation | 0.01 | -3.35 | 1.00 | 4.85 | 0.2723 | -0.2674 | |||
| FDX / FedEx Corporation | 0.00 | -4.98 | 0.89 | -11.41 | 0.2443 | -0.3289 | |||
| ABBV / AbbVie Inc. | 0.00 | -1.00 | 0.83 | -12.35 | 0.2272 | -0.3113 | |||
| HD / The Home Depot, Inc. | 0.00 | -3.85 | 0.78 | -3.84 | 0.2127 | -0.2470 | |||
| MRVL / Marvell Technology, Inc. | 0.01 | 0.76 | 0.3906 | 0.3906 | |||||
| DIS / The Walt Disney Company | 0.01 | -11.62 | 0.74 | 11.03 | 0.3780 | 0.0012 | |||
| UPS / United Parcel Service, Inc. | 0.01 | -7.36 | 0.70 | -14.96 | 0.1912 | -0.2764 | |||
| BMI / Badger Meter, Inc. | 0.00 | 2.10 | 0.68 | 31.33 | 0.3491 | 0.0551 | |||
| VZ / Verizon Communications Inc. | 0.02 | -9.77 | 0.67 | -13.97 | 0.1838 | -0.2601 | |||
| BHP / BHP Group Limited - Depositary Receipt (Common Stock) | 0.01 | -18.86 | 0.63 | -19.64 | 0.1725 | -0.2735 | |||
| CSCO / Cisco Systems, Inc. | 0.01 | -1.04 | 0.56 | 11.33 | 0.1533 | -0.1331 | |||
| EFA / iShares Trust - iShares MSCI EAFE ETF | 0.01 | -16.57 | 0.52 | -8.71 | 0.1434 | -0.1833 | |||
| ZTS / Zoetis Inc. | 0.00 | -17.31 | 0.49 | -21.74 | 0.2499 | -0.1033 | |||
| IBM / International Business Machines Corporation | 0.00 | -1.22 | 0.48 | 17.16 | 0.1308 | -0.1014 | |||
| AMT / American Tower Corporation | 0.00 | -41.55 | 0.45 | -40.69 | 0.1230 | -0.3076 | |||
| ALB / Albemarle Corporation | 0.01 | 21.58 | 0.44 | 5.84 | 0.1191 | -0.1150 | |||
| DE / Deere & Company | 0.00 | -1.16 | 0.43 | 7.16 | 0.1189 | -0.1119 | |||
| WMT / Walmart Inc. | 0.00 | -9.88 | 0.43 | 0.23 | 0.2222 | -0.0229 | |||
| VERSX / Vanguard Emerging Markets Stock Index Fund | 0.01 | -40.16 | 0.42 | -34.64 | 0.1141 | -0.2487 | |||
| TXN / Texas Instruments Incorporated | 0.00 | -21.07 | 0.41 | -8.65 | 0.2117 | -0.0453 | |||
| MA / Mastercard Incorporated | 0.00 | -16.39 | 0.40 | -14.32 | 0.1097 | -0.1564 | |||
| RTX / RTX Corporation | 0.00 | 0.00 | 0.39 | 10.23 | 0.1062 | -0.0940 | |||
| BMY / Bristol-Myers Squibb Company | 0.01 | -4.96 | 0.38 | -27.98 | 0.1044 | -0.1965 | |||
| AFL / Aflac Incorporated | 0.00 | 0.00 | 0.38 | -4.99 | 0.1958 | -0.0327 | |||
| LHX / L3Harris Technologies, Inc. | 0.00 | 3.04 | 0.37 | 23.51 | 0.1022 | -0.0699 | |||
| CB / Chubb Limited | 0.00 | 0.00 | 0.36 | -4.00 | 0.0985 | -0.1149 | |||
| STT / State Street Corporation | 0.00 | -1.75 | 0.36 | 16.94 | 0.0983 | -0.0768 | |||
| GSK / GSK plc - Depositary Receipt (Common Stock) | 0.01 | 0.33 | 0.1696 | 0.1696 | |||||
| PFE / Pfizer Inc. | 0.01 | -6.62 | 0.33 | -10.66 | 0.1681 | -0.0403 | |||
| SCHW / The Charles Schwab Corporation | 0.00 | -4.99 | 0.32 | 10.69 | 0.1652 | 0.0001 | |||
| AVGO / Broadcom Inc. | 0.00 | 0.29 | 0.0780 | 0.0780 | |||||
| PYPL / PayPal Holdings, Inc. | 0.00 | -37.01 | 0.28 | -28.28 | 0.0779 | -0.1477 | |||
| MKC / McCormick & Company, Incorporated | 0.00 | 16.64 | 0.28 | 7.69 | 0.0766 | -0.0716 | |||
| T / AT&T Inc. | 0.01 | -10.22 | 0.28 | -8.33 | 0.1416 | -0.0290 | |||
| MS / Morgan Stanley | 0.00 | -2.15 | 0.27 | 18.50 | 0.0736 | -0.0559 | |||
| TM / Toyota Motor Corporation - Depositary Receipt (Common Stock) | 0.00 | 0.00 | 0.25 | -2.33 | 0.0687 | -0.0777 | |||
| CSX / CSX Corporation | 0.01 | 0.00 | 0.24 | 10.91 | 0.0669 | -0.0586 | |||
| C / Citigroup Inc. | 0.00 | -7.47 | 0.24 | 11.01 | 0.0664 | -0.0580 | |||
| ENB / Enbridge Inc. | 0.01 | -4.30 | 0.23 | -2.16 | 0.0621 | -0.0698 | |||
| GOOG / Alphabet Inc. | 0.00 | -10.44 | 0.22 | 1.83 | 0.0608 | -0.0635 | |||
| BAC / Bank of America Corporation | 0.00 | 0.20 | 0.1047 | 0.1047 | |||||
| CVS / CVS Health Corporation | 0.00 | -100.00 | 0.00 | 0.0000 | |||||
| ZBH / Zimmer Biomet Holdings, Inc. | 0.00 | -100.00 | 0.00 | 0.0000 | |||||
| NKE / NIKE, Inc. | 0.00 | -100.00 | 0.00 | 0.0000 | |||||
| CCI / Crown Castle Inc. | 0.00 | -100.00 | 0.00 | 0.0000 | |||||
| MMM / 3M Company | 0.00 | -100.00 | 0.00 | 0.0000 |