Basic Stats
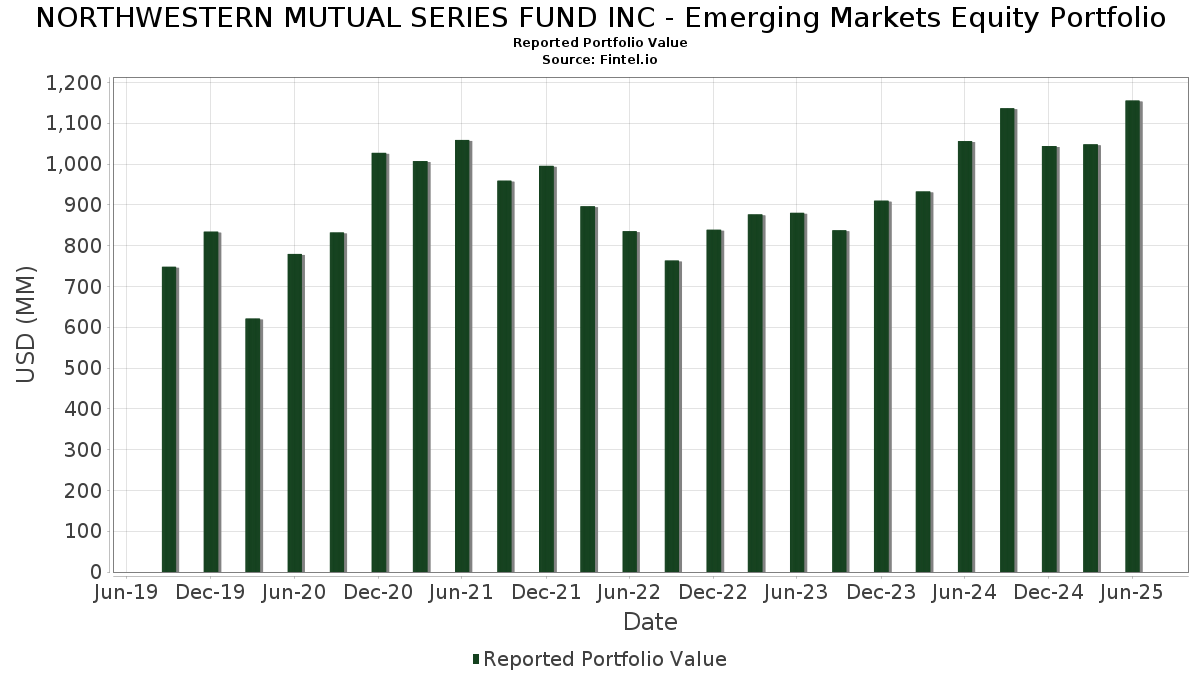
| Portfolio Value | $ 1,155,492,162 |
| Current Positions | 63 |
Latest Holdings, Performance, AUM (from 13F, 13D)
NORTHWESTERN MUTUAL SERIES FUND INC - Emerging Markets Equity Portfolio has disclosed 63 total holdings in their latest SEC filings. Most recent portfolio value is calculated to be $ 1,155,492,162 USD. Actual Assets Under Management (AUM) is this value plus cash (which is not disclosed). NORTHWESTERN MUTUAL SERIES FUND INC - Emerging Markets Equity Portfolio’s top holdings are Taiwan Semiconductor Manufacturing Company Limited (TW:2330) , Tencent Holdings Limited (DE:NNND) , Alibaba Group Holding Limited (DE:2RR) , Samsung Electronics Co Ltd (KR:05935) , and HDFC Bank Ltd (IN:HDFCB) . NORTHWESTERN MUTUAL SERIES FUND INC - Emerging Markets Equity Portfolio’s new positions include Techtronic Industries Company Limited (DE:TIB1) , Zabka Group S.A. (PL:ZAB) , .
Top Increases This Quarter
We use the change in the portfolio allocation because this is the most meaningful metric. Changes can be due to trades or changes in share prices.
| Security | Shares (MM) |
Value (MM$) |
Portfolio % | ΔPortfolio % |
|---|---|---|---|---|
| 4.16 | 150.32 | 12.9244 | 2.1956 | |
| 0.14 | 30.14 | 2.5916 | 1.0221 | |
| 1.04 | 13.30 | 1.1433 | 0.7768 | |
| 0.76 | 8.40 | 0.7226 | 0.7226 | |
| 1.35 | 8.12 | 0.6981 | 0.6981 | |
| 104.48 | 17.90 | 1.5391 | 0.6599 | |
| 0.37 | 16.84 | 1.4483 | 0.6122 | |
| 1.52 | 35.47 | 3.0495 | 0.4767 | |
| 9.28 | 18.71 | 1.6087 | 0.4615 | |
| 0.83 | 19.60 | 1.6849 | 0.4033 |
Top Decreases This Quarter
We use the change in the portfolio allocation because this is the most meaningful metric. Changes can be due to trades or changes in share prices.
| Security | Shares (MM) |
Value (MM$) |
Portfolio % | ΔPortfolio % |
|---|---|---|---|---|
| 0.39 | 6.18 | 0.5314 | -1.5940 | |
| 5.85 | 20.46 | 1.7593 | -0.8511 | |
| 0.00 | 0.00 | -0.8225 | ||
| 1.41 | 90.53 | 7.7841 | -0.7765 | |
| 3.32 | 47.12 | 4.0510 | -0.7265 | |
| 0.80 | 20.34 | 1.7485 | -0.7037 | |
| 12.67 | 4.62 | 0.3977 | -0.5108 | |
| 0.10 | 1.69 | 0.1449 | -0.5019 | |
| 0.45 | 19.24 | 1.6547 | -0.3717 | |
| 0.23 | 13.32 | 1.1451 | -0.2328 |
13F and Fund Filings
This form was filed on 2025-08-19 for the reporting period 2025-06-30. Click the link icon to see the full transaction history.
Upgrade to unlock premium data and export to Excel ![]() .
.
| Security | Type | Avg Share Price | Shares (MM) |
ΔShares (%) |
ΔShares (%) |
Value ($MM) |
Portfolio (%) |
ΔPortfolio (%) |
|
|---|---|---|---|---|---|---|---|---|---|
| 2330 / Taiwan Semiconductor Manufacturing Company Limited | 4.16 | 2.13 | 150.32 | 32.28 | 12.9244 | 2.1956 | |||
| NNND / Tencent Holdings Limited | 1.41 | -0.92 | 90.53 | -0.15 | 7.7841 | -0.7765 | |||
| 2RR / Alibaba Group Holding Limited | 3.32 | 8.78 | 47.12 | -6.89 | 4.0510 | -0.7265 | |||
| 05935 / Samsung Electronics Co Ltd | 1.23 | 2.16 | 45.17 | 15.82 | 3.8840 | 0.2016 | |||
| HDFCB / HDFC Bank Ltd | 1.52 | 18.83 | 35.47 | 30.15 | 3.0495 | 0.4767 | |||
| 000660 / SK hynix Inc. | 0.14 | 11.01 | 30.14 | 81.32 | 2.5916 | 1.0221 | |||
| 300750 / Contemporary Amperex Technology Co., Limited | 0.73 | 11.37 | 25.56 | 11.87 | 2.1979 | 0.0405 | |||
| ICICIBANK / ICICI Bank Limited | 1.51 | -6.51 | 25.48 | -0.09 | 2.1904 | -0.2170 | |||
| SCCO / Southern Copper Corporation | 0.24 | -5.80 | 23.82 | 1.97 | 2.0482 | -0.1575 | |||
| BKE1 / PT Bank Negara Indonesia (Persero) Tbk - Depositary Receipt (Common Stock) | 81.85 | 19.31 | 20.85 | 19.91 | 1.7925 | 0.1510 | |||
| ADIB / Abu Dhabi Islamic Bank PJSC | 3.52 | 0.00 | 20.60 | 33.94 | 1.7715 | 0.3191 | |||
| POWERGRID / Power Grid Corporation of India Limited | 5.85 | -28.48 | 20.46 | -25.99 | 1.7593 | -0.8511 | |||
| CIHKY / China Merchants Bank Co., Ltd. - Depositary Receipt (Common Stock) | 2.92 | 18.27 | 20.41 | 40.68 | 1.7548 | 0.3851 | |||
| RJHI / COMMON STOCK SAR10. | 0.80 | -15.82 | 20.34 | -21.71 | 1.7485 | -0.7037 | |||
| 2020 / ANTA Sports Products Limited | 1.66 | 0.00 | 20.00 | 9.26 | 1.7198 | -0.0086 | |||
| BHARTIARTL / Bharti Airtel Limited | 0.83 | 24.43 | 19.60 | 44.36 | 1.6849 | 0.4033 | |||
| 2454 / MediaTek Inc. | 0.45 | -11.20 | 19.24 | -10.33 | 1.6547 | -0.3717 | |||
| ITSA4 / Itaúsa S.A. - Preferred Stock | 9.28 | 26.52 | 18.71 | 53.98 | 1.6087 | 0.4615 | |||
| SBILIFE / SBI Life Insurance Company Limited | 0.86 | 14.64 | 18.51 | 36.51 | 1.5917 | 0.3113 | |||
| 2328 / PICC Property and Casualty Company Limited | 9.36 | -4.57 | 18.17 | 0.01 | 1.5621 | -0.1531 | |||
| M&M / Mahindra & Mahindra Limited | 0.48 | 0.00 | 18.00 | 19.42 | 1.5477 | 0.1245 | |||
| TLKM / Perusahaan Perseroan (Persero) PT Telekomunikasi Indonesia Tbk | 104.48 | 63.66 | 17.90 | 92.23 | 1.5391 | 0.6599 | |||
| 1299 / AIA Group Limited | 1.88 | -5.51 | 16.91 | 12.42 | 1.4539 | 0.0337 | |||
| A055550 / Shinhan Financial Group Co., Ltd. | 0.37 | 33.52 | 16.84 | 90.22 | 1.4483 | 0.6122 | |||
| TCS / Tata Consultancy Services Limited | 0.39 | 0.00 | 15.79 | -3.91 | 1.3580 | -0.1938 | |||
| A009540 / HD Korea Shipbuilding & Offshore Engineering Co., Ltd. | 0.06 | -51.13 | 15.71 | -3.36 | 1.3509 | -0.1840 | |||
| INDHOTEL / The Indian Hotels Company Limited | 1.70 | 18.90 | 15.16 | 15.03 | 1.3037 | 0.0591 | |||
| M1Z / Nu Holdings Ltd. | 1.04 | 0.00 | 14.26 | 33.98 | 1.2257 | 0.2212 | |||
| 4GE / Grupo México, S.A.B. de C.V. | 2.31 | 12.95 | 13.97 | 36.83 | 1.2008 | 0.2372 | |||
| 2345 / Accton Technology Corporation | 0.56 | 0.00 | 13.87 | 40.69 | 1.1928 | 0.2617 | |||
| TRP / Torrent Pharmaceuticals Ltd | 0.34 | 0.00 | 13.53 | 5.75 | 1.1637 | -0.0447 | |||
| 9961 / Trip.com Group Limited | 0.23 | 0.00 | 13.32 | -8.74 | 1.1451 | -0.2328 | |||
| ETE / Ekotechnika AG | 1.04 | 176.06 | 13.30 | 242.59 | 1.1433 | 0.7768 | |||
| CHOLAFIN / Cholamandalam Investment and Finance Company Limited | 0.69 | 0.00 | 13.16 | 6.99 | 1.1312 | -0.0298 | |||
| 2308 / Delta Electronics, Inc. | 0.92 | 0.00 | 12.95 | 27.73 | 1.1136 | 0.1562 | |||
| 600519 / Kweichow Moutai Co., Ltd. | 0.06 | 0.00 | 12.81 | -8.45 | 1.1014 | -0.2198 | |||
| FMX / Fomento Económico Mexicano, S.A.B. de C.V. - Depositary Receipt (Common Stock) | 0.12 | 15.87 | 12.71 | 22.29 | 1.0926 | 0.1114 | |||
| ALDAR / Aldar Properties PJSC | 4.93 | 0.00 | 11.97 | 5.89 | 1.0289 | -0.0380 | |||
| 600406 / NARI Technology Co., Ltd. | 3.81 | 0.00 | 11.93 | 3.34 | 1.0259 | -0.0642 | |||
| LA6A / Sanlam Limited | 2.37 | 9.17 | 11.88 | 21.61 | 1.0218 | 0.0992 | |||
| UTCEM / UltraTech Cement Ltd | 0.08 | -9.39 | 11.71 | -4.63 | 1.0067 | -0.1525 | |||
| 000333 / Midea Group Co., Ltd. | 1.18 | 0.00 | 11.22 | -6.66 | 0.9646 | -0.1702 | |||
| L87 / Li Auto Inc. | 0.80 | 6.29 | 10.83 | 13.66 | 0.9310 | 0.0315 | |||
| MELI / MercadoLibre, Inc. | 0.00 | -25.23 | 10.57 | 0.17 | 0.9092 | -0.0874 | |||
| KR7028260008 / Samsung C&T Corp | 0.09 | 0.00 | 10.26 | 49.76 | 0.8819 | 0.2353 | |||
| ASURB / Grupo Aeroportuario del Sureste SAB de CV | 0.32 | -9.73 | 10.13 | 5.28 | 0.8713 | -0.0376 | |||
| 000333 / Midea Group Co., Ltd. | 1.00 | 0.00 | 10.07 | -7.20 | 0.8661 | -0.1587 | |||
| GPL / Godrej Properties Ltd | 0.37 | 53.68 | 10.01 | 69.43 | 0.8603 | 0.3027 | |||
| CHZ / China Resources Land Limited | 2.93 | 0.00 | 9.96 | 1.58 | 0.8560 | -0.0694 | |||
| CNE100002CC3 / Shenzhen Envicool Technology Co Ltd | 2.12 | 159.44 | 8.80 | 99.23 | 0.7569 | 0.3397 | |||
| TIB1 / Techtronic Industries Company Limited | 0.76 | 8.40 | 0.7226 | 0.7226 | |||||
| ZAB / Zabka Group S.A. | 1.35 | 8.12 | 0.6981 | 0.6981 | |||||
| 517354 / Havells India Limited | 0.44 | -17.31 | 7.98 | -16.24 | 0.6858 | -0.2132 | |||
| RADLY / Raia Drogasil S.A. - Depositary Receipt (Common Stock) | 2.53 | 0.00 | 7.05 | -16.63 | 0.6064 | -0.1924 | |||
| INPST / InPost S.A. | 0.40 | 0.00 | 6.67 | 12.87 | 0.5732 | 0.0156 | |||
| KSPI / Joint Stock Company Kaspi.kz - Depositary Receipt (Common Stock) | 0.08 | 0.00 | 6.58 | -8.57 | 0.5661 | -0.1138 | |||
| PRIO3 / Prio S.A. | 0.83 | -22.17 | 6.50 | -12.92 | 0.5588 | -0.1458 | |||
| 3690 / Meituan | 0.39 | -65.31 | 6.18 | -72.55 | 0.5314 | -1.5940 | |||
| INE572A01036 / JB Chemicals & Pharmaceuticals Ltd | 0.29 | 0.00 | 5.60 | 3.44 | 0.4812 | -0.0297 | |||
| 300760 / Shenzhen Mindray Bio-Medical Electronics Co., Ltd. | 0.16 | 0.00 | 5.09 | -3.25 | 0.4375 | -0.0591 | |||
| TALABAT / Talabat Holding plc | 12.67 | -49.19 | 4.62 | -51.94 | 0.3977 | -0.5108 | |||
| 028050 / Samsung E&A Co., Ltd. | 0.10 | -79.62 | 1.69 | -75.41 | 0.1449 | -0.5019 | |||
| 005930 / Samsung Electronics Co., Ltd. | 0.02 | 0.00 | 0.96 | 11.90 | 0.0825 | 0.0016 | |||
| SBER / Sberbank of Russia | 1.47 | 0.00 | 0.00 | 0.0000 | 0.0000 | ||||
| 2327 / Yageo Corporation | 0.00 | -100.00 | 0.00 | -100.00 | -0.8225 |