Basic Stats
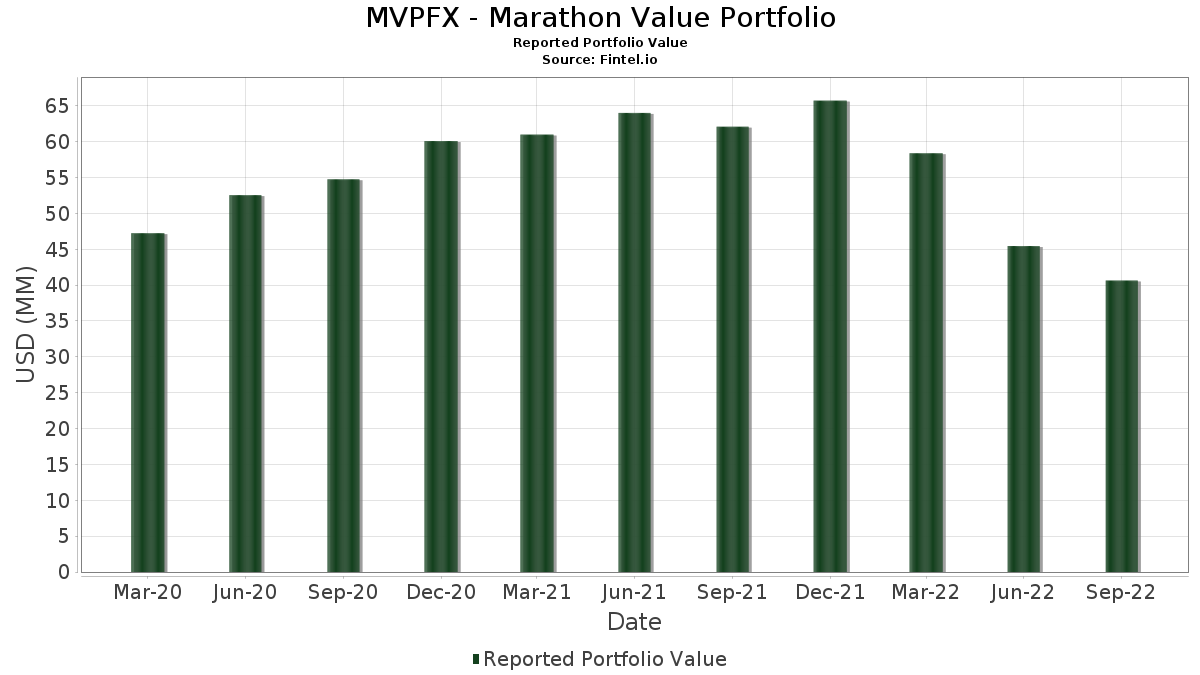
| Portfolio Value | $ 40,648,863 |
| Current Positions | 45 |
Latest Holdings, Performance, AUM (from 13F, 13D)
MVPFX - Marathon Value Portfolio has disclosed 45 total holdings in their latest SEC filings. Most recent portfolio value is calculated to be $ 40,648,863 USD. Actual Assets Under Management (AUM) is this value plus cash (which is not disclosed). MVPFX - Marathon Value Portfolio’s top holdings are Lowe's Companies, Inc. (US:LOW) , Microsoft Corporation (US:MSFT) , Alphabet Inc. (US:GOOG) , Apple Inc. (US:AAPL) , and Costco Wholesale Corporation (US:COST) . MVPFX - Marathon Value Portfolio’s new positions include JPMorgan Alerian MLP Index ETN - Corporate Bond/Note (US:AMJ) , .
Top Increases This Quarter
We use the change in the portfolio allocation because this is the most meaningful metric. Changes can be due to trades or changes in share prices.
| Security | Shares (MM) |
Value (MM$) |
Portfolio % | ΔPortfolio % |
|---|---|---|---|---|
| 0.01 | 2.25 | 5.5391 | 0.9305 | |
| 0.01 | 1.36 | 3.3355 | 0.5646 | |
| 0.00 | 0.19 | 0.4623 | 0.4623 | |
| 0.01 | 1.59 | 3.9183 | 0.4386 | |
| 0.01 | 1.74 | 4.2658 | 0.3639 | |
| 0.01 | 1.18 | 2.9045 | 0.3549 | |
| 0.02 | 1.19 | 2.9174 | 0.3310 | |
| 0.00 | 0.76 | 1.8606 | 0.3029 | |
| 0.00 | 0.50 | 1.2376 | 0.2677 | |
| 0.01 | 1.04 | 2.5503 | 0.2671 |
Top Decreases This Quarter
We use the change in the portfolio allocation because this is the most meaningful metric. Changes can be due to trades or changes in share prices.
| Security | Shares (MM) |
Value (MM$) |
Portfolio % | ΔPortfolio % |
|---|---|---|---|---|
| 0.14 | 0.3450 | -0.8082 | ||
| 0.01 | 1.38 | 3.4026 | -0.7228 | |
| 0.01 | 0.83 | 2.0326 | -0.7139 | |
| 0.00 | 0.00 | -0.5728 | ||
| 0.01 | 0.91 | 2.2422 | -0.3625 | |
| 0.02 | 0.76 | 1.8569 | -0.2486 | |
| 0.00 | 0.26 | 0.6486 | -0.2476 | |
| 0.00 | 1.79 | 4.4108 | -0.2259 | |
| 0.00 | 0.26 | 0.6328 | -0.1430 | |
| 0.02 | 2.12 | 5.2131 | -0.0919 |
13F and Fund Filings
This form was filed on 2022-11-28 for the reporting period 2022-09-30. Click the link icon to see the full transaction history.
Upgrade to unlock premium data and export to Excel ![]() .
.
| Security | Type | Avg Share Price | Shares (MM) |
ΔShares (%) |
ΔShares (%) |
Value ($MM) |
Portfolio (%) |
ΔPortfolio (%) |
|
|---|---|---|---|---|---|---|---|---|---|
| LOW / Lowe's Companies, Inc. | 0.01 | 0.00 | 2.25 | 7.49 | 5.5391 | 0.9305 | |||
| MSFT / Microsoft Corporation | 0.01 | 0.00 | 2.21 | -9.31 | 5.4379 | 0.0733 | |||
| GOOG / Alphabet Inc. | 0.02 | 1,900.00 | 2.12 | -12.06 | 5.2131 | -0.0919 | |||
| AAPL / Apple Inc. | 0.01 | -6.67 | 1.93 | -5.66 | 4.7553 | 0.2462 | |||
| COST / Costco Wholesale Corporation | 0.00 | -13.64 | 1.79 | -14.90 | 4.4108 | -0.2259 | |||
| BRK.B / Berkshire Hathaway Inc. | 0.01 | 0.00 | 1.74 | -2.20 | 4.2658 | 0.3639 | |||
| BDX / Becton, Dickinson and Company | 0.01 | 0.00 | 1.68 | -9.64 | 4.1261 | 0.0423 | |||
| TXN / Texas Instruments Incorporated | 0.01 | 0.00 | 1.59 | 0.76 | 3.9183 | 0.4386 | |||
| MCD / McDonald's Corporation | 0.01 | -21.05 | 1.38 | -26.23 | 3.4026 | -0.7228 | |||
| ADP / Automatic Data Processing, Inc. | 0.01 | 0.00 | 1.36 | 7.70 | 3.3355 | 0.5646 | |||
| SYK / Stryker Corporation | 0.01 | -13.04 | 1.22 | -11.44 | 2.9868 | -0.0312 | |||
| GGG / Graco Inc. | 0.02 | 0.00 | 1.19 | 0.94 | 2.9174 | 0.3310 | |||
| LECO / Lincoln Electric Holdings, Inc. | 0.01 | 0.00 | 1.18 | 1.90 | 2.9045 | 0.3549 | |||
| PEP / PepsiCo, Inc. | 0.01 | -7.79 | 1.16 | -9.66 | 2.8489 | 0.0273 | |||
| GOOGL / Alphabet Inc. | 0.01 | 1,900.00 | 1.15 | -12.24 | 2.8210 | -0.0539 | |||
| PPG / PPG Industries, Inc. | 0.01 | 0.00 | 1.11 | -3.24 | 2.7205 | 0.2065 | |||
| DIS / The Walt Disney Company | 0.01 | 0.00 | 1.04 | -0.10 | 2.5503 | 0.2671 | |||
| VRSK / Verisk Analytics, Inc. | 0.01 | 0.00 | 0.97 | -1.42 | 2.3890 | 0.2197 | |||
| ITW / Illinois Tool Works Inc. | 0.01 | -22.31 | 0.91 | -22.97 | 2.2422 | -0.3625 | |||
| EFX / Equifax Inc. | 0.01 | -7.41 | 0.86 | -13.17 | 2.1067 | -0.0635 | |||
| ABT / Abbott Laboratories | 0.01 | -25.66 | 0.83 | -33.79 | 2.0326 | -0.7139 | |||
| AON / Aon plc | 0.00 | 0.00 | 0.80 | -0.74 | 1.9751 | 0.1962 | |||
| MSI / Motorola Solutions, Inc. | 0.00 | 0.00 | 0.76 | 6.92 | 1.8606 | 0.3029 | |||
| JCI / Johnson Controls International plc | 0.02 | -23.25 | 0.76 | -21.11 | 1.8569 | -0.2486 | |||
| ADI / Analog Devices, Inc. | 0.01 | 0.00 | 0.75 | -4.59 | 1.8401 | 0.1142 | |||
| TEL / TE Connectivity plc | 0.01 | 0.00 | 0.66 | -2.36 | 1.6274 | 0.1347 | |||
| J / Jacobs Solutions Inc. | 0.01 | 0.00 | 0.66 | -14.71 | 1.6265 | -0.0786 | |||
| AMZN / Amazon.com, Inc. | 0.01 | 0.00 | 0.56 | 6.40 | 1.3886 | 0.2210 | |||
| PM / Philip Morris International Inc. | 0.01 | 0.00 | 0.56 | -15.96 | 1.3731 | -0.0880 | |||
| CRM / Salesforce, Inc. | 0.00 | 0.00 | 0.53 | -12.75 | 1.2957 | -0.0343 | |||
| KEYS / Keysight Technologies, Inc. | 0.00 | 0.00 | 0.50 | 14.06 | 1.2376 | 0.2677 | |||
| PWR / Quanta Services, Inc. | 0.00 | 0.00 | 0.49 | 1.66 | 1.2039 | 0.1442 | |||
| ADSK / Autodesk, Inc. | 0.00 | 0.00 | 0.45 | 8.39 | 1.1133 | 0.1965 | |||
| V / Visa Inc. | 0.00 | 0.00 | 0.43 | -9.85 | 1.0588 | 0.0090 | |||
| HAS / Hasbro, Inc. | 0.01 | 0.00 | 0.36 | -17.65 | 0.8948 | -0.0774 | |||
| BX / Blackstone Inc. | 0.00 | 0.00 | 0.36 | -8.42 | 0.8846 | 0.0220 | |||
| META / Meta Platforms, Inc. | 0.00 | 0.00 | 0.35 | -15.87 | 0.8604 | -0.0544 | |||
| LVS / Las Vegas Sands Corp. | 0.01 | 0.00 | 0.35 | 11.54 | 0.8576 | 0.1708 | |||
| SSNC / SS&C Technologies Holdings, Inc. | 0.01 | 0.00 | 0.32 | -17.77 | 0.7980 | -0.0702 | |||
| LBRDA / Liberty Broadband Corporation | 0.00 | 0.00 | 0.26 | -35.38 | 0.6486 | -0.2476 | |||
| SPLK / Splunk Inc. | 0.00 | 0.00 | 0.26 | -15.08 | 0.6376 | -0.0334 | |||
| KMX / CarMax, Inc. | 0.00 | 0.00 | 0.26 | -26.99 | 0.6328 | -0.1430 | |||
| DLTR / Dollar Tree, Inc. | 0.00 | 0.00 | 0.20 | -12.45 | 0.5018 | -0.0123 | |||
| AMJ / JPMorgan Alerian MLP Index ETN - Corporate Bond/Note | 0.00 | 0.19 | 0.4623 | 0.4623 | |||||
| HUNTINGTON CONS DEPOSIT / STIV (N/A) | 0.14 | -76.90 | 0.3450 | -0.8082 | |||||
| NTRS / Northern Trust Corporation | 0.00 | -100.00 | 0.00 | -100.00 | -0.5728 |