Basic Stats
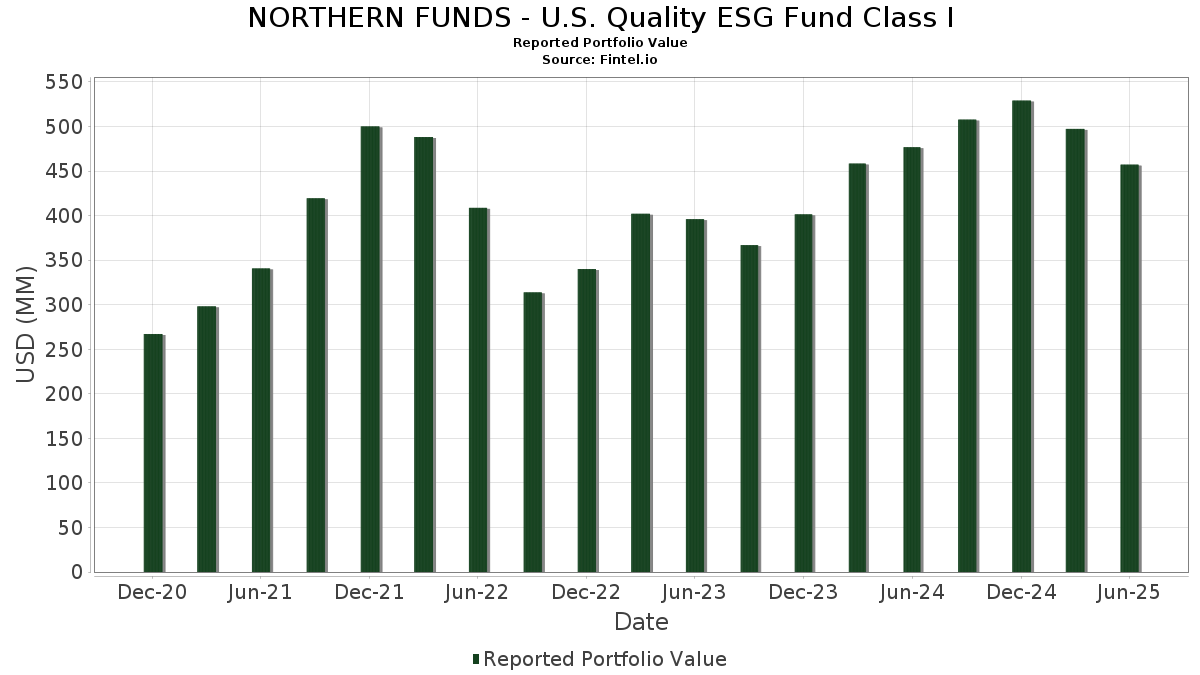
| Portfolio Value | $ 457,210,478 |
| Current Positions | 180 |
Latest Holdings, Performance, AUM (from 13F, 13D)
NORTHERN FUNDS - U.S. Quality ESG Fund Class I has disclosed 180 total holdings in their latest SEC filings. Most recent portfolio value is calculated to be $ 457,210,478 USD. Actual Assets Under Management (AUM) is this value plus cash (which is not disclosed). NORTHERN FUNDS - U.S. Quality ESG Fund Class I’s top holdings are NVIDIA Corporation (US:NVDA) , Microsoft Corporation (US:MSFT) , Apple Inc. (US:AAPL) , Amazon.com, Inc. (US:AMZN) , and Alphabet Inc. (US:GOOGL) . NORTHERN FUNDS - U.S. Quality ESG Fund Class I’s new positions include GE Vernova Inc. (US:GEV) , Crown Holdings, Inc. (US:CCK) , Millicom International Cellular S.A. (US:TIGO) , Capital One Financial Corporation (US:COF) , and Bentley Systems, Incorporated (US:BSY) .
Top Increases This Quarter
We use the change in the portfolio allocation because this is the most meaningful metric. Changes can be due to trades or changes in share prices.
| Security | Shares (MM) |
Value (MM$) |
Portfolio % | ΔPortfolio % |
|---|---|---|---|---|
| 0.20 | 31.98 | 7.0793 | 1.7562 | |
| 0.06 | 31.39 | 6.9486 | 1.2005 | |
| 0.03 | 9.63 | 2.1309 | 1.1076 | |
| 2.81 | 0.6230 | 0.6230 | ||
| 2.81 | 0.6230 | 0.6230 | ||
| 0.01 | 2.85 | 0.6312 | 0.4635 | |
| 0.02 | 12.23 | 2.7073 | 0.3900 | |
| 0.00 | 1.73 | 0.3839 | 0.3839 | |
| 0.01 | 1.88 | 0.4170 | 0.3507 | |
| 0.01 | 1.35 | 0.2996 | 0.2996 |
Top Decreases This Quarter
We use the change in the portfolio allocation because this is the most meaningful metric. Changes can be due to trades or changes in share prices.
| Security | Shares (MM) |
Value (MM$) |
Portfolio % | ΔPortfolio % |
|---|---|---|---|---|
| 0.00 | 1.18 | 0.2612 | -1.1197 | |
| 0.12 | 25.18 | 5.5744 | -1.0409 | |
| 0.00 | 0.27 | 0.0597 | -0.5073 | |
| 2.53 | 2.53 | 0.5598 | -0.4919 | |
| 0.01 | 0.91 | 0.2018 | -0.3786 | |
| 0.00 | 0.22 | 0.0484 | -0.3629 | |
| 0.01 | 2.57 | 0.5691 | -0.3430 | |
| 0.02 | 2.86 | 0.6329 | -0.3273 | |
| 0.00 | 1.00 | 0.2210 | -0.3270 | |
| 0.00 | 0.21 | 0.0460 | -0.3030 |
13F and Fund Filings
This form was filed on 2025-08-26 for the reporting period 2025-06-30. Click the link icon to see the full transaction history.
Upgrade to unlock premium data and export to Excel ![]() .
.
| Security | Type | Avg Share Price | Shares (MM) |
ΔShares (%) |
ΔShares (%) |
Value ($MM) |
Portfolio (%) |
ΔPortfolio (%) |
|
|---|---|---|---|---|---|---|---|---|---|
| NVDA / NVIDIA Corporation | 0.20 | -16.27 | 31.98 | 22.06 | 7.0793 | 1.7562 | |||
| MSFT / Microsoft Corporation | 0.06 | -16.27 | 31.39 | 10.95 | 6.9486 | 1.2005 | |||
| AAPL / Apple Inc. | 0.12 | -16.27 | 25.18 | -22.66 | 5.5744 | -1.0409 | |||
| AMZN / Amazon.com, Inc. | 0.06 | -14.66 | 14.24 | -1.60 | 3.1534 | 0.2124 | |||
| GOOGL / Alphabet Inc. | 0.08 | -16.27 | 14.18 | -4.58 | 3.1399 | 0.1198 | |||
| META / Meta Platforms, Inc. | 0.02 | -16.27 | 12.23 | 7.23 | 2.7073 | 0.3900 | |||
| JPM / JPMorgan Chase & Co. | 0.03 | -19.31 | 9.84 | -4.63 | 2.1776 | 0.0817 | |||
| AVGO / Broadcom Inc. | 0.03 | 16.08 | 9.63 | 91.12 | 2.1309 | 1.1076 | |||
| IBM / International Business Machines Corporation | 0.02 | -19.37 | 5.57 | -4.43 | 1.2324 | 0.0490 | |||
| ABBV / AbbVie Inc. | 0.03 | -16.27 | 5.25 | -25.82 | 1.1623 | -0.2757 | |||
| INTU / Intuit Inc. | 0.01 | -26.40 | 5.05 | -5.58 | 1.1174 | 0.0312 | |||
| BKNG / Booking Holdings Inc. | 0.00 | -21.53 | 4.94 | -1.38 | 1.0933 | 0.0757 | |||
| TSLA / Tesla, Inc. | 0.02 | -0.72 | 4.88 | 21.70 | 1.0804 | 0.2655 | |||
| BRK.B / Berkshire Hathaway Inc. | 0.01 | -21.03 | 4.85 | -27.98 | 1.0741 | -0.2946 | |||
| MS / Morgan Stanley | 0.03 | -19.97 | 4.76 | -3.39 | 1.0538 | 0.0528 | |||
| HD / The Home Depot, Inc. | 0.01 | -20.62 | 4.72 | -20.59 | 1.0451 | -0.1627 | |||
| CRM / Salesforce, Inc. | 0.02 | -16.27 | 4.62 | -14.91 | 1.0230 | -0.0805 | |||
| NFLX / Netflix, Inc. | 0.00 | -16.27 | 4.61 | 20.24 | 1.0207 | 0.2416 | |||
| C / Citigroup Inc. | 0.05 | -16.27 | 4.50 | 0.40 | 0.9955 | 0.0854 | |||
| PG / The Procter & Gamble Company | 0.03 | -16.27 | 4.46 | -21.72 | 0.9868 | -0.1702 | |||
| AMAT / Applied Materials, Inc. | 0.02 | -16.27 | 4.42 | 5.64 | 0.9791 | 0.1284 | |||
| GILD / Gilead Sciences, Inc. | 0.04 | -16.27 | 4.16 | -17.15 | 0.9217 | -0.0993 | |||
| LRCX / Lam Research Corporation | 0.04 | -16.27 | 3.96 | 12.09 | 0.8765 | 0.1589 | |||
| ADP / Automatic Data Processing, Inc. | 0.01 | -18.11 | 3.94 | -17.34 | 0.8717 | -0.0962 | |||
| LOW / Lowe's Companies, Inc. | 0.02 | -16.26 | 3.73 | -20.35 | 0.8259 | -0.1257 | |||
| ACN / Accenture plc | 0.01 | -20.08 | 3.69 | -23.45 | 0.8161 | -0.1623 | |||
| V / Visa Inc. | 0.01 | -6.53 | 3.49 | -5.31 | 0.7736 | 0.0238 | |||
| COST / Costco Wholesale Corporation | 0.00 | -16.26 | 3.21 | -12.34 | 0.7112 | -0.0335 | |||
| ADBE / Adobe Inc. | 0.01 | -16.27 | 3.21 | -15.54 | 0.7099 | -0.0615 | |||
| TT / Trane Technologies plc | 0.01 | -18.66 | 3.06 | 5.60 | 0.6764 | 0.0885 | |||
| MCK / McKesson Corporation | 0.00 | -20.08 | 2.88 | -12.99 | 0.6379 | -0.0349 | |||
| FI / Fiserv, Inc. | 0.02 | -22.51 | 2.86 | -39.51 | 0.6329 | -0.3273 | |||
| UNP / Union Pacific Corporation | 0.01 | 254.67 | 2.85 | 245.58 | 0.6312 | 0.4635 | |||
| FUT. EMINI S&P SEP25 / DE (000000000) | 2.81 | 0.6230 | 0.6230 | ||||||
| FUT. EMINI S&P SEP25 / DE (000000000) | 2.81 | 0.6230 | 0.6230 | ||||||
| LLY / Eli Lilly and Company | 0.00 | -22.24 | 2.79 | -26.62 | 0.6185 | -0.1550 | |||
| CAT / Caterpillar Inc. | 0.01 | -16.27 | 2.69 | -1.47 | 0.5953 | 0.0409 | |||
| CI / The Cigna Group | 0.01 | -16.27 | 2.67 | -15.86 | 0.5919 | -0.0538 | |||
| MMM / 3M Company | 0.02 | -16.27 | 2.62 | -13.19 | 0.5799 | -0.0333 | |||
| GOOG / Alphabet Inc. | 0.01 | -49.56 | 2.57 | -42.75 | 0.5691 | -0.3430 | |||
| US6652784041 / NORTHERN INSTITUTIONAL GOVERNMENT PORTFOLIO | 2.53 | -51.15 | 2.53 | -51.15 | 0.5598 | -0.4919 | |||
| HLT / Hilton Worldwide Holdings Inc. | 0.01 | -16.26 | 2.37 | -2.02 | 0.5258 | 0.0334 | |||
| BK / The Bank of New York Mellon Corporation | 0.03 | -16.27 | 2.33 | -9.03 | 0.5151 | -0.0047 | |||
| CL / Colgate-Palmolive Company | 0.03 | -16.27 | 2.32 | -18.78 | 0.5145 | -0.0668 | |||
| MA / Mastercard Incorporated | 0.00 | -16.26 | 2.28 | -14.16 | 0.5047 | -0.0349 | |||
| ITW / Illinois Tool Works Inc. | 0.01 | -16.27 | 2.27 | -16.54 | 0.5018 | -0.0499 | |||
| ECL / Ecolab Inc. | 0.01 | -16.27 | 2.26 | -11.02 | 0.5004 | -0.0157 | |||
| BMY / Bristol-Myers Squibb Company | 0.05 | -16.27 | 2.26 | -36.46 | 0.4999 | -0.2220 | |||
| ADSK / Autodesk, Inc. | 0.01 | -16.27 | 2.24 | -1.02 | 0.4956 | 0.0362 | |||
| LNG / Cheniere Energy, Inc. | 0.01 | 2.50 | 2.23 | 7.90 | 0.4926 | 0.0735 | |||
| CAH / Cardinal Health, Inc. | 0.01 | -20.23 | 2.22 | -2.71 | 0.4922 | 0.0278 | |||
| CSCO / Cisco Systems, Inc. | 0.03 | -16.27 | 2.22 | -5.85 | 0.4913 | 0.0123 | |||
| EME / EMCOR Group, Inc. | 0.00 | -16.27 | 2.19 | 21.20 | 0.4849 | 0.1176 | |||
| CBRE / CBRE Group, Inc. | 0.02 | -16.27 | 2.16 | -10.29 | 0.4788 | -0.0111 | |||
| SHW / The Sherwin-Williams Company | 0.01 | -16.27 | 2.13 | -17.67 | 0.4714 | -0.0541 | |||
| MET / MetLife, Inc. | 0.03 | -7.76 | 2.13 | -7.64 | 0.4713 | 0.0031 | |||
| IDXX / IDEXX Laboratories, Inc. | 0.00 | -26.78 | 2.12 | -6.48 | 0.4695 | 0.0087 | |||
| VRSK / Verisk Analytics, Inc. | 0.01 | -16.27 | 2.10 | -12.39 | 0.4653 | -0.0220 | |||
| FAST / Fastenal Company | 0.05 | 60.98 | 2.09 | -12.80 | 0.4632 | -0.0244 | |||
| FIS / Fidelity National Information Services, Inc. | 0.03 | -16.27 | 2.06 | -8.73 | 0.4559 | -0.0025 | |||
| STT / State Street Corporation | 0.02 | -16.27 | 2.05 | -0.53 | 0.4539 | 0.0350 | |||
| EA / Electronic Arts Inc. | 0.01 | -16.26 | 2.05 | -7.46 | 0.4531 | 0.0037 | |||
| KMB / Kimberly-Clark Corporation | 0.02 | -8.16 | 2.03 | -16.74 | 0.4484 | -0.0459 | |||
| JNJ / Johnson & Johnson | 0.01 | -16.27 | 2.02 | -22.89 | 0.4463 | -0.0848 | |||
| HIG / The Hartford Insurance Group, Inc. | 0.02 | -16.27 | 1.97 | -14.14 | 0.4369 | -0.0301 | |||
| SYF / Synchrony Financial | 0.03 | -16.27 | 1.97 | 5.57 | 0.4368 | 0.0570 | |||
| BR / Broadridge Financial Solutions, Inc. | 0.01 | -16.27 | 1.94 | -16.09 | 0.4285 | -0.0401 | |||
| AFL / Aflac Incorporated | 0.02 | -16.27 | 1.93 | -20.61 | 0.4283 | -0.0667 | |||
| PNR / Pentair plc | 0.02 | -10.89 | 1.93 | 4.60 | 0.4280 | 0.0524 | |||
| WAT / Waters Corporation | 0.01 | -2.57 | 1.92 | -7.70 | 0.4248 | 0.0022 | |||
| EQH / Equitable Holdings, Inc. | 0.03 | -16.27 | 1.91 | -9.83 | 0.4226 | -0.0075 | |||
| MTD / Mettler-Toledo International Inc. | 0.00 | -8.05 | 1.91 | -8.55 | 0.4218 | -0.0014 | |||
| TPR / Tapestry, Inc. | 0.02 | 71.04 | 1.89 | 113.33 | 0.4180 | 0.2382 | |||
| SLM / SLM Corporation | 0.06 | -16.27 | 1.89 | -6.49 | 0.4176 | 0.0076 | |||
| VEEV / Veeva Systems Inc. | 0.01 | 363.90 | 1.88 | 477.61 | 0.4170 | 0.3507 | |||
| VLTO / Veralto Corporation | 0.02 | -16.27 | 1.87 | -13.28 | 0.4151 | -0.0241 | |||
| RGLD / Royal Gold, Inc. | 0.01 | -16.27 | 1.87 | -8.94 | 0.4151 | -0.0032 | |||
| GWW / W.W. Grainger, Inc. | 0.00 | -16.29 | 1.87 | -11.83 | 0.4143 | -0.0170 | |||
| SPOT / Spotify Technology S.A. | 0.00 | -16.25 | 1.87 | 16.88 | 0.4140 | 0.0888 | |||
| UGI / UGI Corporation | 0.05 | -16.27 | 1.86 | -7.78 | 0.4123 | 0.0019 | |||
| FTI / TechnipFMC plc | 0.05 | -27.05 | 1.86 | -20.74 | 0.4122 | -0.0650 | |||
| BEPC / Brookfield Renewable Corporation | 0.06 | -19.34 | 1.82 | -5.30 | 0.4036 | 0.0124 | |||
| MTG / MGIC Investment Corporation | 0.07 | -16.27 | 1.82 | -5.89 | 0.4034 | 0.0098 | |||
| K / Kellanova | 0.02 | -16.27 | 1.74 | -19.25 | 0.3855 | -0.0528 | |||
| UNM / Unum Group | 0.02 | -16.27 | 1.74 | -17.02 | 0.3854 | -0.0407 | |||
| INGR / Ingredion Incorporated | 0.01 | -16.27 | 1.74 | -16.01 | 0.3844 | -0.0357 | |||
| GEV / GE Vernova Inc. | 0.00 | 1.73 | 0.3839 | 0.3839 | |||||
| WTW / Willis Towers Watson Public Limited Company | 0.01 | -16.26 | 1.73 | -24.06 | 0.3837 | -0.0800 | |||
| CWEN / Clearway Energy, Inc. | 0.05 | -16.27 | 1.72 | -11.47 | 0.3811 | -0.0140 | |||
| LII / Lennox International Inc. | 0.00 | -16.26 | 1.71 | -14.44 | 0.3792 | -0.0274 | |||
| WSM / Williams-Sonoma, Inc. | 0.01 | -16.27 | 1.71 | -13.51 | 0.3788 | -0.0230 | |||
| DOCS / Doximity, Inc. | 0.03 | -16.27 | 1.69 | -11.49 | 0.3736 | -0.0138 | |||
| MPC / Marathon Petroleum Corporation | 0.01 | -16.27 | 1.68 | -4.54 | 0.3726 | 0.0144 | |||
| HAS / Hasbro, Inc. | 0.02 | -16.27 | 1.67 | 0.48 | 0.3697 | 0.0321 | |||
| AVB / AvalonBay Communities, Inc. | 0.01 | -16.27 | 1.67 | -20.60 | 0.3687 | -0.0575 | |||
| DBX / Dropbox, Inc. | 0.06 | -16.27 | 1.66 | -10.34 | 0.3686 | -0.0087 | |||
| CDNS / Cadence Design Systems, Inc. | 0.01 | -21.24 | 1.66 | -4.59 | 0.3685 | 0.0141 | |||
| BLD / TopBuild Corp. | 0.01 | -16.26 | 1.64 | -11.10 | 0.3635 | -0.0118 | |||
| ODFL / Old Dominion Freight Line, Inc. | 0.01 | -16.27 | 1.64 | -17.85 | 0.3627 | -0.0426 | |||
| PCTY / Paylocity Holding Corporation | 0.01 | -16.26 | 1.64 | -19.01 | 0.3622 | -0.0483 | |||
| EXPD / Expeditors International of Washington, Inc. | 0.01 | -16.27 | 1.62 | -20.46 | 0.3582 | -0.0550 | |||
| IVZ / Invesco Ltd. | 0.10 | -19.80 | 1.62 | -16.66 | 0.3579 | -0.0361 | |||
| DVA / DaVita Inc. | 0.01 | -16.27 | 1.61 | -22.01 | 0.3554 | -0.0629 | |||
| PRU / Prudential Financial, Inc. | 0.01 | -20.23 | 1.59 | -23.27 | 0.3527 | -0.0691 | |||
| IRDM / Iridium Communications Inc. | 0.05 | 143.13 | 1.58 | 168.77 | 0.3488 | 0.2296 | |||
| AYI / Acuity Inc. | 0.01 | -20.74 | 1.56 | -10.17 | 0.3460 | -0.0077 | |||
| EOG / EOG Resources, Inc. | 0.01 | -16.27 | 1.54 | -21.88 | 0.3408 | -0.0597 | |||
| TNL / Travel + Leisure Co. | 0.03 | 5.11 | 1.53 | 17.23 | 0.3390 | 0.0735 | |||
| XOM / Exxon Mobil Corporation | 0.01 | -33.26 | 1.51 | -39.50 | 0.3348 | -0.1732 | |||
| HOLX / Hologic, Inc. | 0.02 | -16.27 | 1.50 | -11.68 | 0.3316 | -0.0130 | |||
| SEE / Sealed Air Corporation | 0.05 | -16.27 | 1.49 | -10.05 | 0.3288 | -0.0069 | |||
| QCOM / QUALCOMM Incorporated | 0.01 | -16.27 | 1.48 | -13.18 | 0.3268 | -0.0187 | |||
| CROX / Crocs, Inc. | 0.01 | -25.30 | 1.48 | -28.78 | 0.3267 | -0.0942 | |||
| JHG / Janus Henderson Group plc | 0.04 | -20.47 | 1.46 | -14.59 | 0.3230 | -0.0239 | |||
| FICO / Fair Isaac Corporation | 0.00 | -26.88 | 1.44 | -27.55 | 0.3181 | -0.0847 | |||
| IT / Gartner, Inc. | 0.00 | -16.26 | 1.40 | -19.35 | 0.3092 | -0.0427 | |||
| CCK / Crown Holdings, Inc. | 0.01 | 1.35 | 0.2996 | 0.2996 | |||||
| PAYX / Paychex, Inc. | 0.01 | -16.26 | 1.32 | -21.06 | 0.2929 | -0.0476 | |||
| VLO / Valero Energy Corporation | 0.01 | -16.27 | 1.32 | -14.78 | 0.2912 | -0.0224 | |||
| APP / AppLovin Corporation | 0.00 | -16.27 | 1.31 | 10.68 | 0.2892 | 0.0493 | |||
| AVY / Avery Dennison Corporation | 0.01 | -39.75 | 1.19 | -40.62 | 0.2630 | -0.1433 | |||
| AMGN / Amgen Inc. | 0.00 | -77.97 | 1.18 | -78.66 | 0.2612 | -1.1197 | |||
| SLB / Schlumberger Limited | 0.03 | 80.74 | 1.18 | 46.14 | 0.2602 | 0.0968 | |||
| PFE / Pfizer Inc. | 0.05 | 1.13 | 0.2499 | 0.2499 | |||||
| WMT / Walmart Inc. | 0.01 | -10.01 | 1.11 | 0.27 | 0.2458 | 0.0207 | |||
| PYPL / PayPal Holdings, Inc. | 0.01 | 62.49 | 1.09 | 85.08 | 0.2418 | 0.1219 | |||
| LSTR / Landstar System, Inc. | 0.01 | -16.27 | 1.00 | -22.50 | 0.2213 | -0.0408 | |||
| AMP / Ameriprise Financial, Inc. | 0.00 | -71.13 | 1.00 | -53.60 | 0.2210 | -0.3270 | |||
| FHB / First Hawaiian, Inc. | 0.04 | -16.27 | 0.99 | -14.50 | 0.2182 | -0.0160 | |||
| DUK / Duke Energy Corporation | 0.01 | -16.27 | 0.98 | -19.01 | 0.2181 | -0.0290 | |||
| HWM / Howmet Aerospace Inc. | 0.01 | 179.40 | 0.98 | 301.63 | 0.2179 | 0.1680 | |||
| CBSH / Commerce Bancshares, Inc. | 0.02 | -16.27 | 0.98 | -16.42 | 0.2165 | -0.0210 | |||
| PEG / Public Service Enterprise Group Incorporated | 0.01 | -16.27 | 0.97 | -14.31 | 0.2147 | -0.0154 | |||
| KLAC / KLA Corporation | 0.00 | -16.24 | 0.95 | 10.39 | 0.2096 | 0.0353 | |||
| EXC / Exelon Corporation | 0.02 | -16.27 | 0.94 | -21.04 | 0.2077 | -0.0339 | |||
| ETSY / Etsy, Inc. | 0.02 | 314.29 | 0.93 | 274.90 | 0.2051 | 0.1563 | |||
| ZTS / Zoetis Inc. | 0.01 | -66.31 | 0.91 | -68.10 | 0.2018 | -0.3786 | |||
| ACM / AECOM | 0.01 | -16.27 | 0.90 | 1.82 | 0.1983 | 0.0197 | |||
| CLX / The Clorox Company | 0.01 | -49.54 | 0.83 | -58.86 | 0.1846 | -0.2272 | |||
| A / Agilent Technologies, Inc. | 0.01 | -23.76 | 0.82 | -23.12 | 0.1812 | -0.0350 | |||
| NEM / Newmont Corporation | 0.01 | 0.82 | 0.1811 | 0.1811 | |||||
| NTAP / NetApp, Inc. | 0.01 | 21.83 | 0.82 | 47.74 | 0.1810 | 0.0686 | |||
| TIGO / Millicom International Cellular S.A. | 0.02 | 0.80 | 0.1776 | 0.1776 | |||||
| COF / Capital One Financial Corporation | 0.00 | 0.80 | 0.1766 | 0.1766 | |||||
| GS / The Goldman Sachs Group, Inc. | 0.00 | -16.26 | 0.79 | 8.47 | 0.1760 | 0.0271 | |||
| EBAY / eBay Inc. | 0.01 | 84.63 | 0.79 | 103.09 | 0.1745 | 0.0956 | |||
| MAS / Masco Corporation | 0.01 | -16.27 | 0.79 | -22.46 | 0.1743 | -0.0321 | |||
| CHRW / C.H. Robinson Worldwide, Inc. | 0.01 | -16.26 | 0.75 | -21.54 | 0.1670 | -0.0284 | |||
| VOYA / Voya Financial, Inc. | 0.01 | -16.27 | 0.70 | -12.23 | 0.1541 | -0.0071 | |||
| NKE / NIKE, Inc. | 0.01 | 4.41 | 0.64 | -16.17 | 0.1425 | -0.0090 | |||
| ABNB / Airbnb, Inc. | 0.00 | -1.72 | 0.64 | 8.81 | 0.1422 | 0.0223 | |||
| ALLY / Ally Financial Inc. | 0.02 | -16.26 | 0.62 | -10.62 | 0.1381 | -0.0036 | |||
| ULTA / Ulta Beauty, Inc. | 0.00 | -16.29 | 0.62 | 6.75 | 0.1368 | 0.0193 | |||
| HPQ / HP Inc. | 0.02 | -16.27 | 0.61 | -26.03 | 0.1353 | -0.0326 | |||
| BBY / Best Buy Co., Inc. | 0.01 | -16.27 | 0.60 | -23.67 | 0.1336 | -0.0270 | |||
| MSI / Motorola Solutions, Inc. | 0.00 | -16.24 | 0.57 | -19.61 | 0.1272 | -0.0179 | |||
| LNW / Light & Wonder, Inc. | 0.01 | 73.08 | 0.50 | 92.31 | 0.1108 | 0.0580 | |||
| DPZ / Domino's Pizza, Inc. | 0.00 | -16.25 | 0.49 | -17.86 | 0.1090 | -0.0128 | |||
| AIG / American International Group, Inc. | 0.01 | -16.26 | 0.48 | -17.72 | 0.1071 | -0.0121 | |||
| COR / Cencora, Inc. | 0.00 | -16.28 | 0.40 | -9.79 | 0.0878 | -0.0015 | |||
| PAYC / Paycom Software, Inc. | 0.00 | -16.25 | 0.39 | -11.46 | 0.0874 | -0.0030 | |||
| OTIS / Otis Worldwide Corporation | 0.00 | -16.26 | 0.39 | -19.59 | 0.0872 | -0.0124 | |||
| CTAS / Cintas Corporation | 0.00 | -16.26 | 0.37 | -9.14 | 0.0816 | -0.0009 | |||
| FFIV / F5, Inc. | 0.00 | -16.28 | 0.36 | -7.61 | 0.0807 | 0.0007 | |||
| TDC / Teradata Corporation | 0.02 | -16.27 | 0.36 | -17.05 | 0.0799 | -0.0083 | |||
| PH / Parker-Hannifin Corporation | 0.00 | 13.25 | 0.33 | 30.16 | 0.0727 | 0.0214 | |||
| GDDY / GoDaddy Inc. | 0.00 | -16.26 | 0.29 | -16.33 | 0.0636 | -0.0061 | |||
| ROK / Rockwell Automation, Inc. | 0.00 | -79.03 | 0.28 | -74.06 | 0.0614 | -0.1496 | |||
| ORCL / Oracle Corporation | 0.00 | -96.27 | 0.27 | -88.34 | 0.0597 | -0.5073 | |||
| MANH / Manhattan Associates, Inc. | 0.00 | -16.26 | 0.25 | -4.18 | 0.0558 | 0.0022 | |||
| BSY / Bentley Systems, Incorporated | 0.00 | 0.24 | 0.0539 | 0.0539 | |||||
| AMG / Affiliated Managers Group, Inc. | 0.00 | -16.29 | 0.24 | -2.04 | 0.0533 | 0.0034 | |||
| BAC / Bank of America Corporation | 0.00 | -16.27 | 0.23 | -4.94 | 0.0512 | 0.0017 | |||
| BRX / Brixmor Property Group Inc. | 0.01 | 0.23 | 0.0510 | 0.0510 | |||||
| UNH / UnitedHealth Group Incorporated | 0.00 | -81.86 | 0.22 | -89.23 | 0.0484 | -0.3629 | |||
| PLTR / Palantir Technologies Inc. | 0.00 | 0.22 | 0.0481 | 0.0481 | |||||
| HRB / H&R Block, Inc. | 0.00 | -16.26 | 0.22 | -16.22 | 0.0481 | -0.0046 | |||
| D / Dominion Energy, Inc. | 0.00 | -16.26 | 0.21 | -15.73 | 0.0465 | -0.0041 | |||
| GIS / General Mills, Inc. | 0.00 | -86.03 | 0.21 | -87.94 | 0.0460 | -0.3030 | |||
| UNITED STATES TSY. 0.00% / DBT (US912797NL78) | 0.20 | 0.0437 | 0.0437 | ||||||
| HAL / Halliburton Company | 0.00 | -100.00 | 0.00 | -100.00 | -0.0541 | ||||
| CVX / Chevron Corporation | 0.00 | -100.00 | 0.00 | -100.00 | -0.0513 |