Basic Stats
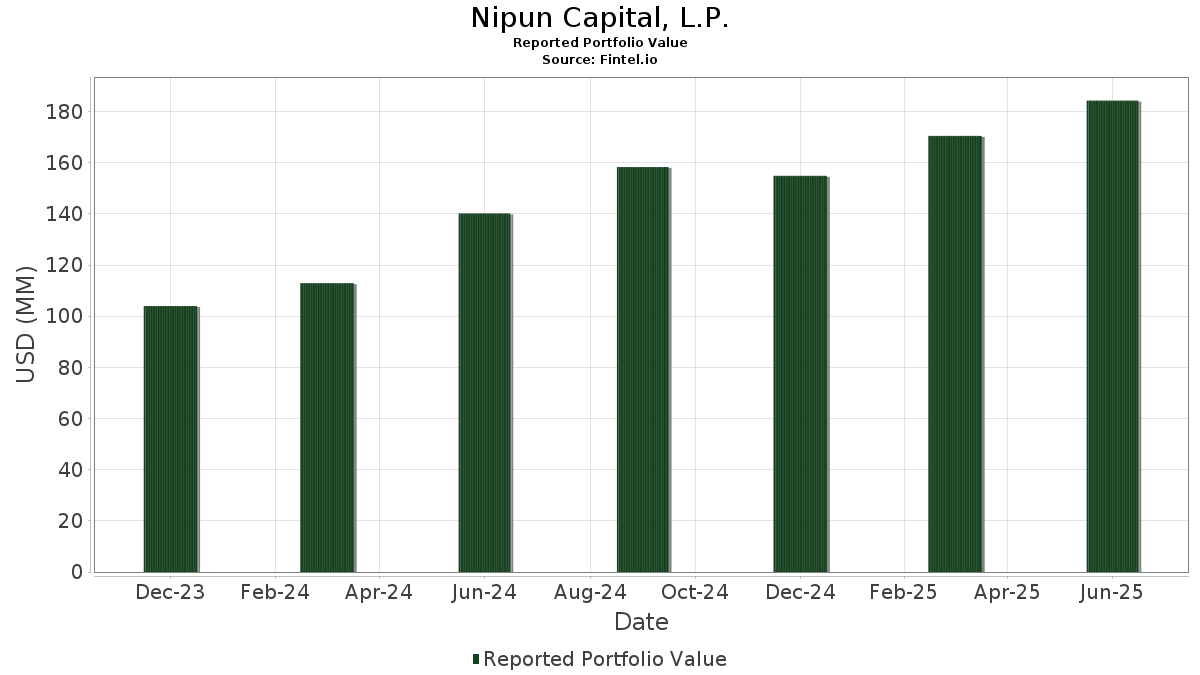
| Portfolio Value | $ 184,299,083 |
| Current Positions | 12 |
Latest Holdings, Performance, AUM (from 13F, 13D)
Nipun Capital, L.P. has disclosed 12 total holdings in their latest SEC filings. Most recent portfolio value is calculated to be $ 184,299,083 USD. Actual Assets Under Management (AUM) is this value plus cash (which is not disclosed). Nipun Capital, L.P.’s top holdings are iShares Trust - iShares MSCI India ETF (US:INDA) , iShares Trust - iShares MSCI China ETF (US:MCHI) , iShares Trust - iShares China Large-Cap ETF (US:FXI) , iShares Trust - iShares MSCI India Small-Cap ETF (US:SMIN) , and Vanguard International Equity Index Funds - Vanguard FTSE Emerging Markets ETF (US:VWO) . Nipun Capital, L.P.’s new positions include Yalla Group Limited - Depositary Receipt (Common Stock) (US:YALA) , CI&T Inc. (US:CINT) , StealthGas Inc. (US:GASS) , .
Top Increases This Quarter
We use the change in the portfolio allocation because this is the most meaningful metric. Changes can be due to trades or changes in share prices.
| Security | Shares (MM) |
Value (MM$) |
Portfolio % | ΔPortfolio % |
|---|---|---|---|---|
| 1.77 | 98.72 | 53.5638 | 0.7260 | |
| 0.54 | 19.99 | 10.8475 | 0.3508 | |
| 0.15 | 11.87 | 6.4430 | 0.2987 | |
| 0.01 | 1.95 | 1.0569 | 0.2196 | |
| 0.06 | 0.38 | 0.2073 | 0.2073 | |
| 0.04 | 1.56 | 0.8476 | 0.1312 | |
| 0.02 | 0.11 | 0.0603 | 0.0603 | |
| 0.01 | 0.09 | 0.0491 | 0.0491 | |
| 0.11 | 5.45 | 2.9574 | 0.0321 | |
| 0.01 | 0.28 | 0.1515 | 0.0093 |
Top Decreases This Quarter
We use the change in the portfolio allocation because this is the most meaningful metric. Changes can be due to trades or changes in share prices.
| Security | Shares (MM) |
Value (MM$) |
Portfolio % | ΔPortfolio % |
|---|---|---|---|---|
| 0.03 | 2.72 | 1.4765 | -1.3556 | |
| 0.75 | 41.17 | 22.3391 | -0.5667 |
13F and Fund Filings
This form was filed on 2025-08-12 for the reporting period 2025-06-30. Click the link icon to see the full transaction history.
Upgrade to unlock premium data and export to Excel ![]() .
.