Basic Stats
| Portfolio Value | $ 864,798,793 |
| Current Positions | 31 |
Latest Holdings, Performance, AUM (from 13F, 13D)
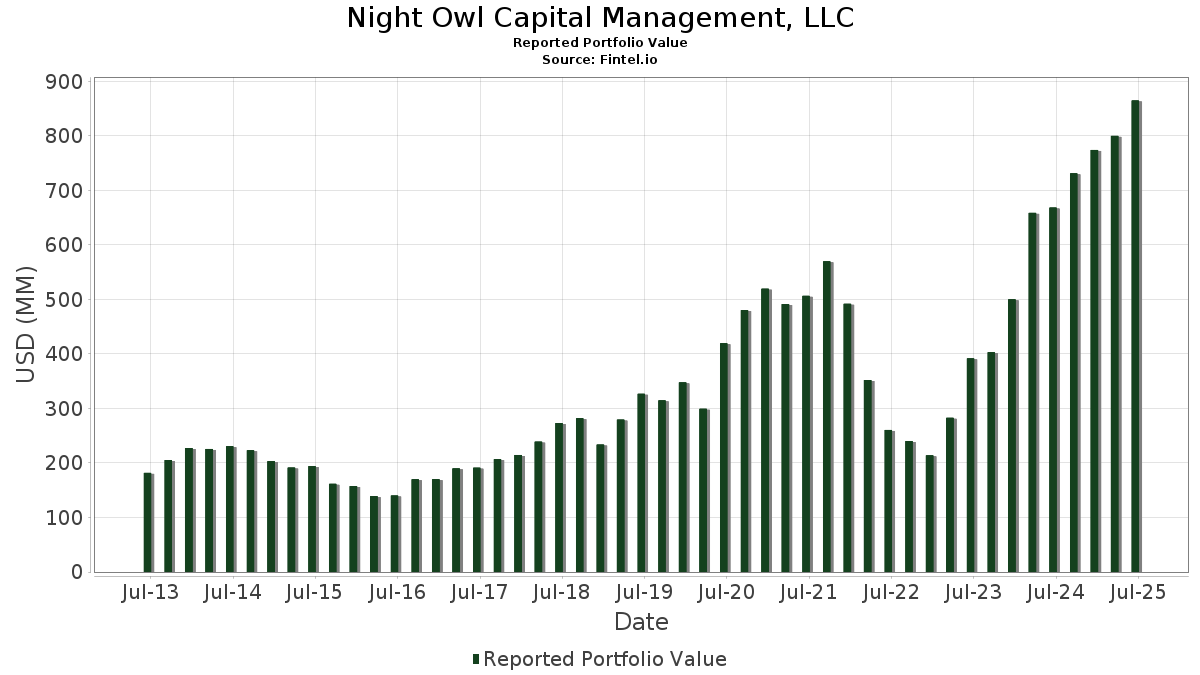
Night Owl Capital Management, LLC has disclosed 31 total holdings in their latest SEC filings. Most recent portfolio value is calculated to be $ 864,798,793 USD. Actual Assets Under Management (AUM) is this value plus cash (which is not disclosed). Night Owl Capital Management, LLC’s top holdings are Amazon.com, Inc. (US:AMZN) , SAP SE - Depositary Receipt (Common Stock) (US:SAP) , Microsoft Corporation (US:MSFT) , Alphabet Inc. (US:GOOG) , and GE Vernova Inc. (US:GEV) . Night Owl Capital Management, LLC’s new positions include Woodward, Inc. (US:WWD) , MercadoLibre, Inc. (US:MELI) , Spotify Technology S.A. (US:SPOT) , .
Top Increases This Quarter
We use the change in the portfolio allocation because this is the most meaningful metric. Changes can be due to trades or changes in share prices.
| Security | Shares (MM) |
Value (MM$) |
Portfolio % | ΔPortfolio % |
|---|---|---|---|---|
| 0.15 | 73.12 | 8.4557 | 2.2932 | |
| 0.08 | 19.33 | 2.2353 | 2.2353 | |
| 0.08 | 18.59 | 2.1491 | 2.1491 | |
| 0.21 | 18.88 | 2.1829 | 1.2020 | |
| 0.00 | 10.06 | 1.1630 | 1.1630 | |
| 0.01 | 9.92 | 1.1476 | 1.1476 | |
| 0.34 | 74.28 | 8.5896 | 1.0183 | |
| 0.16 | 35.29 | 4.0805 | 0.9459 | |
| 0.44 | 40.90 | 4.7289 | 0.8548 | |
| 0.05 | 40.07 | 4.6329 | 0.8430 |
Top Decreases This Quarter
We use the change in the portfolio allocation because this is the most meaningful metric. Changes can be due to trades or changes in share prices.
| Security | Shares (MM) |
Value (MM$) |
Portfolio % | ΔPortfolio % |
|---|---|---|---|---|
| 0.16 | 26.83 | 3.1027 | -4.6573 | |
| 0.11 | 37.85 | 4.3764 | -3.5337 | |
| 0.08 | 18.64 | 2.1548 | -1.9018 | |
| 0.12 | 22.30 | 2.5781 | -0.5852 | |
| 0.07 | 21.02 | 2.4309 | -0.5486 | |
| 0.02 | 31.69 | 3.6643 | -0.4910 | |
| 0.32 | 56.18 | 6.4962 | -0.4817 | |
| 0.09 | 33.03 | 3.8193 | -0.1341 | |
| 0.05 | 23.77 | 2.7487 | -0.1149 | |
| 0.05 | 29.61 | 3.4240 | -0.0757 |
13F and Fund Filings
This form was filed on 2025-08-14 for the reporting period 2025-06-30. Click the link icon to see the full transaction history.
Upgrade to unlock premium data and export to Excel ![]() .
.
| Security | Type | Avg Share Price | Shares (MM) |
ΔShares (%) |
ΔShares (%) |
Value ($MM) |
Portfolio (%) |
ΔPortfolio (%) |
|
|---|---|---|---|---|---|---|---|---|---|
| AMZN / Amazon.com, Inc. | 0.34 | 6.36 | 74.28 | 22.65 | 8.5896 | 1.0183 | |||
| SAP / SAP SE - Depositary Receipt (Common Stock) | 0.24 | 3.02 | 73.89 | 16.71 | 8.5440 | 0.6296 | |||
| MSFT / Microsoft Corporation | 0.15 | 11.95 | 73.12 | 48.33 | 8.4557 | 2.2932 | |||
| GOOG / Alphabet Inc. | 0.32 | -11.36 | 56.18 | 0.64 | 6.4962 | -0.4817 | |||
| GEV / GE Vernova Inc. | 0.09 | -27.78 | 46.69 | 25.19 | 5.3994 | 0.7367 | |||
| UBER / Uber Technologies, Inc. | 0.44 | 3.05 | 40.90 | 31.96 | 4.7289 | 0.8548 | |||
| META / Meta Platforms, Inc. | 0.05 | 3.20 | 40.07 | 32.15 | 4.6329 | 0.8430 | |||
| GE / General Electric Company | 0.15 | 3.01 | 39.03 | 32.48 | 4.5132 | 0.8302 | |||
| AON / Aon plc | 0.11 | -33.09 | 37.85 | -40.19 | 4.3764 | -3.5337 | |||
| TSM / Taiwan Semiconductor Manufacturing Company Limited - Depositary Receipt (Common Stock) | 0.16 | 3.14 | 35.29 | 40.73 | 4.0805 | 0.9459 | |||
| V / Visa Inc. | 0.09 | 3.09 | 33.03 | 4.44 | 3.8193 | -0.1341 | |||
| NFLX / Netflix, Inc. | 0.02 | -33.61 | 31.69 | -4.67 | 3.6643 | -0.4910 | |||
| MA / Mastercard Incorporated | 0.05 | 3.17 | 29.61 | 5.77 | 3.4240 | -0.0757 | |||
| FI / Fiserv, Inc. | 0.16 | -44.64 | 26.83 | -56.78 | 3.1027 | -4.6573 | |||
| LIN / Linde plc | 0.05 | 2.99 | 23.77 | 3.77 | 2.7487 | -0.1149 | |||
| VST / Vistra Corp. | 0.12 | -46.61 | 22.30 | -11.89 | 2.5781 | -0.5852 | |||
| CEG / Constellation Energy Corporation | 0.07 | -44.90 | 21.02 | -11.80 | 2.4309 | -0.5486 | |||
| WWD / Woodward, Inc. | 0.08 | 19.33 | 2.2353 | 2.2353 | |||||
| BIL / SPDR Series Trust - SPDR Bloomberg 1-3 Month T-Bill ETF | 0.21 | 140.59 | 18.88 | 140.59 | 2.1829 | 1.2020 | |||
| UNP / Union Pacific Corporation | 0.08 | -41.04 | 18.64 | -42.57 | 2.1548 | -1.9018 | |||
| GWRE / Guidewire Software, Inc. | 0.08 | 18.59 | 2.1491 | 2.1491 | |||||
| AVGO / Broadcom Inc. | 0.07 | 3.06 | 18.05 | 69.68 | 2.0869 | 0.7573 | |||
| HWM / Howmet Aerospace Inc. | 0.08 | 3.17 | 14.86 | 48.03 | 1.7179 | 0.4633 | |||
| CRS / Carpenter Technology Corporation | 0.05 | 3.15 | 14.06 | 57.36 | 1.6263 | 0.5089 | |||
| MELI / MercadoLibre, Inc. | 0.00 | 10.06 | 1.1630 | 1.1630 | |||||
| SPOT / Spotify Technology S.A. | 0.01 | 9.92 | 1.1476 | 1.1476 | |||||
| CSGP / CoStar Group, Inc. | 0.11 | 2.94 | 8.59 | 4.46 | 0.9938 | -0.0347 | |||
| SGOV / iShares Trust - iShares 0-3 Month Treasury Bond ETF | 0.06 | 81.42 | 6.47 | 81.48 | 0.7480 | 0.3024 | |||
| BRK.A / Berkshire Hathaway Inc. | 0.00 | 0.00 | 0.73 | -8.77 | 0.0843 | -0.0155 | |||
| GOOGL / Alphabet Inc. | 0.00 | 0.00 | 0.60 | 14.10 | 0.0693 | 0.0036 | |||
| BRK.B / Berkshire Hathaway Inc. | 0.00 | 0.00 | 0.49 | -8.83 | 0.0562 | -0.0104 | |||
| UNH / UnitedHealth Group Incorporated | 0.00 | -100.00 | 0.00 | 0.0000 |