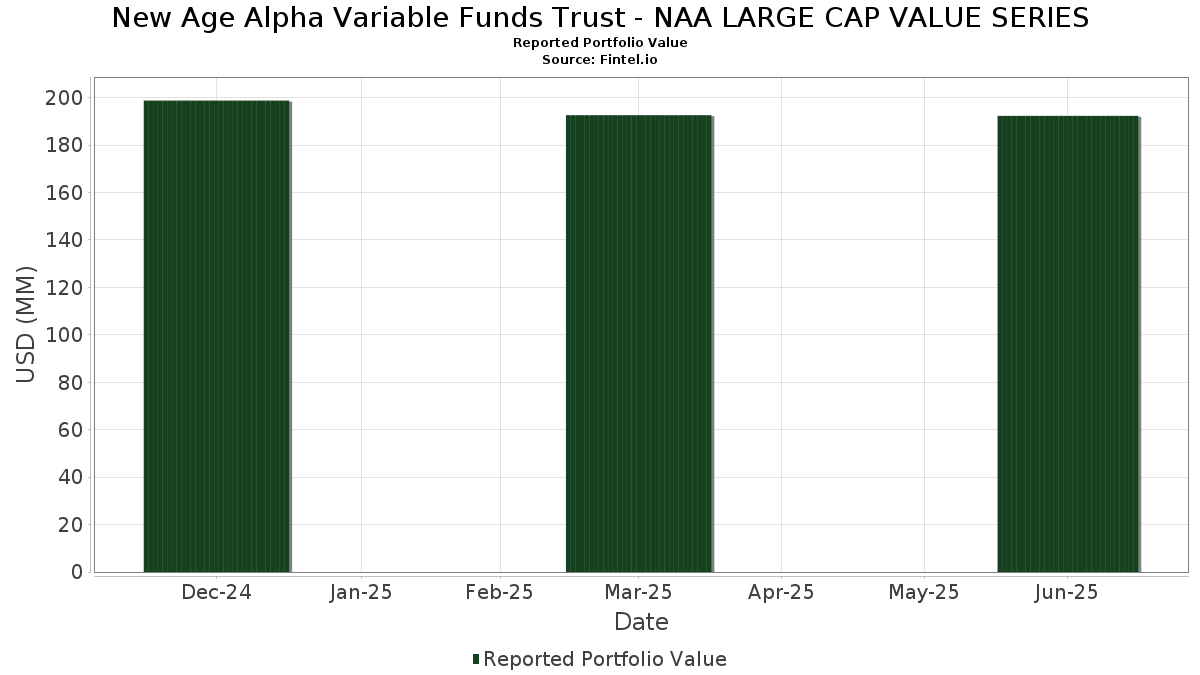
Basic Stats
| Portfolio Value | $ 192,303,868 |
| Current Positions | 103 |
Latest Holdings, Performance, AUM (from 13F, 13D)
New Age Alpha Variable Funds Trust - NAA LARGE CAP VALUE SERIES has disclosed 103 total holdings in their latest SEC filings. Most recent portfolio value is calculated to be $ 192,303,868 USD. Actual Assets Under Management (AUM) is this value plus cash (which is not disclosed). New Age Alpha Variable Funds Trust - NAA LARGE CAP VALUE SERIES’s top holdings are Microsoft Corporation (US:MSFT) , Apple Inc. (US:AAPL) , Amazon.com, Inc. (US:AMZN) , Exxon Mobil Corporation (US:XOM) , and Berkshire Hathaway Inc. (US:BRK.B) . New Age Alpha Variable Funds Trust - NAA LARGE CAP VALUE SERIES’s new positions include Johnson & Johnson (US:JNJ) , AT&T Inc. (US:T) , Lam Research Corporation (US:LRCX) , Morgan Stanley (US:MS) , and Newmont Corporation (US:NEM) .
Top Increases This Quarter
We use the change in the portfolio allocation because this is the most meaningful metric. Changes can be due to trades or changes in share prices.
| Security | Shares (MM) |
Value (MM$) |
Portfolio % | ΔPortfolio % |
|---|---|---|---|---|
| 0.03 | 13.60 | 7.0772 | 1.6254 | |
| 0.02 | 2.82 | 1.4662 | 1.4662 | |
| 0.07 | 1.92 | 0.9984 | 0.9984 | |
| 0.02 | 1.92 | 0.9982 | 0.9982 | |
| 0.01 | 1.92 | 0.9974 | 0.9974 | |
| 0.03 | 1.78 | 0.9271 | 0.9271 | |
| 0.05 | 1.73 | 0.9005 | 0.9005 | |
| 0.05 | 1.67 | 0.8676 | 0.8676 | |
| 0.02 | 1.66 | 0.8629 | 0.8629 | |
| 0.02 | 1.54 | 0.8023 | 0.8023 |
Top Decreases This Quarter
We use the change in the portfolio allocation because this is the most meaningful metric. Changes can be due to trades or changes in share prices.
| Security | Shares (MM) |
Value (MM$) |
Portfolio % | ΔPortfolio % |
|---|---|---|---|---|
| 0.00 | 0.00 | -0.9121 | ||
| 0.01 | 2.17 | 1.1280 | -0.8986 | |
| 0.06 | 12.68 | 6.5958 | -0.7636 | |
| 0.00 | 0.00 | -0.6791 | ||
| 0.00 | 0.00 | -0.6620 | ||
| 0.04 | 1.17 | 0.6113 | -0.3278 | |
| 0.01 | 0.93 | 0.4854 | -0.2926 | |
| 0.00 | 1.08 | 0.5597 | -0.2734 | |
| 0.03 | 3.56 | 1.8538 | -0.2734 | |
| 0.00 | 0.92 | 0.4790 | -0.2550 |
13F and Fund Filings
This form was filed on 2025-08-28 for the reporting period 2025-06-30. Click the link icon to see the full transaction history.
Upgrade to unlock premium data and export to Excel ![]() .
.
| Security | Type | Avg Share Price | Shares (MM) |
ΔShares (%) |
ΔShares (%) |
Value ($MM) |
Portfolio (%) |
ΔPortfolio (%) |
|
|---|---|---|---|---|---|---|---|---|---|
| MSFT / Microsoft Corporation | 0.03 | -1.84 | 13.60 | 30.07 | 7.0772 | 1.6254 | |||
| AAPL / Apple Inc. | 0.06 | -2.78 | 12.68 | -10.20 | 6.5958 | -0.7636 | |||
| AMZN / Amazon.com, Inc. | 0.03 | -1.66 | 6.67 | 13.41 | 3.4726 | 0.4041 | |||
| XOM / Exxon Mobil Corporation | 0.03 | -3.66 | 3.56 | -12.70 | 1.8538 | -0.2734 | |||
| BRK.B / Berkshire Hathaway Inc. | 0.01 | -2.45 | 3.48 | -11.03 | 1.8087 | -0.2282 | |||
| PG / The Procter & Gamble Company | 0.02 | -2.02 | 2.86 | -8.41 | 1.4900 | -0.1399 | |||
| JNJ / Johnson & Johnson | 0.02 | 2.82 | 1.4662 | 1.4662 | |||||
| JPM / JPMorgan Chase & Co. | 0.01 | -3.91 | 2.66 | 13.56 | 1.3817 | 0.1626 | |||
| BAC / Bank of America Corporation | 0.05 | -3.71 | 2.38 | 9.20 | 1.2362 | 0.1018 | |||
| UNH / UnitedHealth Group Incorporated | 0.01 | -6.37 | 2.17 | -44.25 | 1.1280 | -0.8986 | |||
| NKE / NIKE, Inc. | 0.03 | 37.18 | 2.14 | 53.58 | 1.1158 | 0.3876 | |||
| GS / The Goldman Sachs Group, Inc. | 0.00 | -1.84 | 2.04 | 27.15 | 1.0602 | 0.2249 | |||
| C / Citigroup Inc. | 0.02 | -3.77 | 1.98 | 15.42 | 1.0326 | 0.1359 | |||
| WFC / Wells Fargo & Company | 0.02 | 0.04 | 1.97 | 11.67 | 1.0258 | 0.1052 | |||
| COF / Capital One Financial Corporation | 0.01 | 0.38 | 1.96 | 19.11 | 1.0215 | 0.1622 | |||
| CSCO / Cisco Systems, Inc. | 0.03 | -5.38 | 1.94 | 6.42 | 1.0095 | 0.0587 | |||
| IVE / iShares Trust - iShares S&P 500 Value ETF | 0.01 | -1.64 | 1.93 | 0.83 | 1.0060 | 0.0066 | |||
| DIS / The Walt Disney Company | 0.02 | 2.93 | 1.93 | 29.36 | 1.0045 | 0.2262 | |||
| IWD / iShares Trust - iShares Russell 1000 Value ETF | 0.01 | -4.28 | 1.93 | -1.18 | 1.0040 | -0.0141 | |||
| T / AT&T Inc. | 0.07 | 1.92 | 0.9984 | 0.9984 | |||||
| LRCX / Lam Research Corporation | 0.02 | 1.92 | 0.9982 | 0.9982 | |||||
| MS / Morgan Stanley | 0.01 | 1.92 | 0.9974 | 0.9974 | |||||
| TMUS / T-Mobile US, Inc. | 0.01 | 11.52 | 1.91 | -0.37 | 0.9940 | -0.0058 | |||
| QCOM / QUALCOMM Incorporated | 0.01 | 8.79 | 1.90 | 12.80 | 0.9864 | 0.1102 | |||
| INTC / Intel Corporation | 0.08 | 2.46 | 1.89 | 1.07 | 0.9816 | 0.0084 | |||
| KO / The Coca-Cola Company | 0.03 | -2.22 | 1.88 | -3.38 | 0.9804 | -0.0366 | |||
| FCX / Freeport-McMoRan Inc. | 0.04 | 7.91 | 1.88 | 23.62 | 0.9778 | 0.1849 | |||
| WMT / Walmart Inc. | 0.02 | 4.37 | 1.88 | 16.31 | 0.9761 | 0.1348 | |||
| GILD / Gilead Sciences, Inc. | 0.02 | -9.62 | 1.87 | -10.56 | 0.9741 | -0.1173 | |||
| USB / U.S. Bancorp | 0.04 | 24.15 | 1.87 | 33.07 | 0.9738 | 0.2405 | |||
| CB / Chubb Limited | 0.01 | 3.26 | 1.86 | -0.90 | 0.9688 | -0.0111 | |||
| ELV / Elevance Health, Inc. | 0.00 | 5.82 | 1.86 | -5.39 | 0.9682 | -0.0570 | |||
| DUK / Duke Energy Corporation | 0.02 | 0.67 | 1.86 | -2.62 | 0.9677 | -0.0279 | |||
| AMT / American Tower Corporation | 0.01 | -2.94 | 1.86 | -1.43 | 0.9666 | -0.0158 | |||
| CVS / CVS Health Corporation | 0.03 | -21.39 | 1.85 | -19.98 | 0.9651 | -0.2431 | |||
| MU / Micron Technology, Inc. | 0.01 | -14.79 | 1.84 | 20.81 | 0.9578 | 0.1638 | |||
| MDLZ / Mondelez International, Inc. | 0.03 | -0.46 | 1.83 | -1.08 | 0.9529 | -0.0121 | |||
| F / Ford Motor Company | 0.17 | 5.06 | 1.83 | 13.66 | 0.9527 | 0.1128 | |||
| MRK / Merck & Co., Inc. | 0.02 | 34.09 | 1.83 | 18.31 | 0.9518 | 0.1453 | |||
| JCI / Johnson Controls International plc | 0.02 | -14.35 | 1.82 | 12.94 | 0.9494 | 0.1070 | |||
| CL / Colgate-Palmolive Company | 0.02 | 12.03 | 1.82 | 8.74 | 0.9454 | 0.0738 | |||
| ECL / Ecolab Inc. | 0.01 | 2.15 | 1.82 | 8.55 | 0.9452 | 0.0729 | |||
| XYL / Xylem Inc. | 0.01 | 3.15 | 1.81 | 11.73 | 0.9420 | 0.0970 | |||
| EXC / Exelon Corporation | 0.04 | -7.92 | 1.81 | -13.20 | 0.9413 | -0.1457 | |||
| NOC / Northrop Grumman Corporation | 0.00 | 2.61 | 1.81 | 0.22 | 0.9394 | 0.0001 | |||
| ZTS / Zoetis Inc. | 0.01 | 21.35 | 1.80 | 14.99 | 0.9383 | 0.1203 | |||
| SBUX / Starbucks Corporation | 0.02 | 11.66 | 1.80 | 4.29 | 0.9358 | 0.0369 | |||
| TRV / The Travelers Companies, Inc. | 0.01 | -2.27 | 1.80 | -1.10 | 0.9357 | -0.0126 | |||
| TJX / The TJX Companies, Inc. | 0.01 | 8.77 | 1.79 | 10.34 | 0.9330 | 0.0853 | |||
| COR / Cencora, Inc. | 0.01 | -16.94 | 1.79 | -10.42 | 0.9303 | -0.1105 | |||
| CAH / Cardinal Health, Inc. | 0.01 | -23.65 | 1.78 | -6.94 | 0.9282 | -0.0707 | |||
| ADP / Automatic Data Processing, Inc. | 0.01 | 3.07 | 1.78 | 4.03 | 0.9280 | 0.0342 | |||
| NEM / Newmont Corporation | 0.03 | 1.78 | 0.9271 | 0.9271 | |||||
| LHX / L3Harris Technologies, Inc. | 0.01 | -4.74 | 1.78 | 14.18 | 0.9259 | 0.1132 | |||
| CVX / Chevron Corporation | 0.01 | -5.80 | 1.78 | -19.38 | 0.9243 | -0.2243 | |||
| HUM / Humana Inc. | 0.01 | 19.43 | 1.77 | 10.33 | 0.9228 | 0.0849 | |||
| CSGP / CoStar Group, Inc. | 0.02 | 4.42 | 1.77 | 5.98 | 0.9216 | 0.0501 | |||
| DLR / Digital Realty Trust, Inc. | 0.01 | 11.70 | 1.75 | 35.97 | 0.9128 | 0.2398 | |||
| MO / Altria Group, Inc. | 0.03 | -2.20 | 1.75 | -4.48 | 0.9095 | -0.0444 | |||
| AMGN / Amgen Inc. | 0.01 | 0.14 | 1.74 | -10.27 | 0.9051 | -0.1054 | |||
| COP / ConocoPhillips | 0.02 | 13.48 | 1.74 | -3.02 | 0.9040 | -0.0301 | |||
| DE / Deere & Company | 0.00 | -11.23 | 1.74 | -3.82 | 0.9035 | -0.0378 | |||
| BKR / Baker Hughes Company | 0.05 | 1.73 | 0.9005 | 0.9005 | |||||
| CNC / Centene Corporation | 0.03 | 11.87 | 1.72 | 0.06 | 0.8924 | -0.0016 | |||
| AWK / American Water Works Company, Inc. | 0.01 | -1.76 | 1.71 | -7.36 | 0.8910 | -0.0727 | |||
| IQV / IQVIA Holdings Inc. | 0.01 | 29.01 | 1.69 | 15.32 | 0.8774 | 0.1150 | |||
| SLB / Schlumberger Limited | 0.05 | 1.67 | 0.8676 | 0.8676 | |||||
| HCA / HCA Healthcare, Inc. | 0.00 | -16.97 | 1.66 | -7.98 | 0.8641 | -0.0765 | |||
| AEE / Ameren Corporation | 0.02 | 1.66 | 0.8629 | 0.8629 | |||||
| PYPL / PayPal Holdings, Inc. | 0.02 | 19.73 | 1.64 | 36.47 | 0.8529 | 0.2262 | |||
| TROW / T. Rowe Price Group, Inc. | 0.02 | 1.54 | 0.8023 | 0.8023 | |||||
| BBH Overnight Sweep / STIV (N/A) | 1.47 | 0.7652 | 0.7652 | ||||||
| VRSN / VeriSign, Inc. | 0.01 | -32.93 | 1.46 | -23.73 | 0.7580 | -0.2373 | |||
| FE / FirstEnergy Corp. | 0.03 | -19.15 | 1.32 | -19.46 | 0.6850 | -0.1673 | |||
| DXCM / DexCom, Inc. | 0.01 | -27.87 | 1.29 | -7.81 | 0.6698 | -0.0581 | |||
| LUV / Southwest Airlines Co. | 0.04 | -18.89 | 1.29 | -21.60 | 0.6686 | -0.1863 | |||
| MKC / McCormick & Company, Incorporated | 0.02 | -17.56 | 1.25 | -24.10 | 0.6494 | -0.2074 | |||
| DLTR / Dollar Tree, Inc. | 0.01 | 1.18 | 0.6130 | 0.6130 | |||||
| INVH / Invitation Homes Inc. | 0.04 | -30.70 | 1.17 | -34.81 | 0.6113 | -0.3278 | |||
| EXR / Extra Space Storage Inc. | 0.01 | -28.04 | 1.12 | -28.56 | 0.5844 | -0.2352 | |||
| ODFL / Old Dominion Freight Line, Inc. | 0.01 | -14.96 | 1.11 | -16.60 | 0.5754 | -0.1157 | |||
| SNA / Snap-on Incorporated | 0.00 | -27.10 | 1.08 | -32.73 | 0.5597 | -0.2734 | |||
| EVRG / Evergy, Inc. | 0.01 | -29.12 | 1.02 | -29.11 | 0.5297 | -0.2193 | |||
| J / Jacobs Solutions Inc. | 0.01 | -32.04 | 1.00 | -26.09 | 0.5188 | -0.1846 | |||
| LYB / LyondellBasell Industries N.V. | 0.02 | 0.97 | 0.5045 | 0.5045 | |||||
| OMC / Omnicom Group Inc. | 0.01 | -27.96 | 0.93 | -37.53 | 0.4854 | -0.2926 | |||
| TXT / Textron Inc. | 0.01 | -31.85 | 0.93 | -24.31 | 0.4831 | -0.1561 | |||
| EG / Everest Group, Ltd. | 0.00 | -30.09 | 0.92 | -34.61 | 0.4790 | -0.2550 | |||
| RJF / Raymond James Financial, Inc. | 0.01 | 0.88 | 0.4597 | 0.4597 | |||||
| PPL / PPL Corporation | 0.02 | -30.75 | 0.76 | -35.01 | 0.3962 | -0.2146 | |||
| AKAM / Akamai Technologies, Inc. | 0.01 | -32.50 | 0.73 | -33.12 | 0.3806 | -0.1896 | |||
| NTAP / NetApp, Inc. | 0.01 | -30.42 | 0.72 | -15.56 | 0.3758 | -0.0704 | |||
| LKQ / LKQ Corporation | 0.02 | -25.78 | 0.65 | -35.39 | 0.3382 | -0.1866 | |||
| FSLR / First Solar, Inc. | 0.00 | -21.69 | 0.60 | 2.55 | 0.3138 | 0.0072 | |||
| FDS / FactSet Research Systems Inc. | 0.00 | -30.38 | 0.59 | -31.51 | 0.3067 | -0.1420 | |||
| TAP / Molson Coors Beverage Company | 0.01 | -27.51 | 0.56 | -42.78 | 0.2892 | -0.2168 | |||
| TECH / Bio-Techne Corporation | 0.01 | -29.62 | 0.52 | -38.20 | 0.2712 | -0.1687 | |||
| MTCH / Match Group, Inc. | 0.02 | -30.84 | 0.50 | -31.55 | 0.2599 | -0.1204 | |||
| CRL / Charles River Laboratories International, Inc. | 0.00 | -30.23 | 0.49 | -29.68 | 0.2541 | -0.1079 | |||
| BEN / Franklin Resources, Inc. | 0.02 | -33.05 | 0.45 | -16.94 | 0.2347 | -0.0488 | |||
| MGM / MGM Resorts International | 0.01 | -37.48 | 0.44 | -27.47 | 0.2297 | -0.0876 | |||
| ROL / Rollins, Inc. | 0.01 | -29.48 | 0.43 | -26.47 | 0.2216 | -0.0799 | |||
| INCY / Incyte Corporation | 0.00 | -29.74 | 0.28 | -20.95 | 0.1474 | -0.0395 | |||
| AMCR / Amcor plc | 0.00 | -100.00 | 0.00 | -100.00 | -0.6620 | ||||
| MCP / Microchip Technology Incorporated | 0.00 | -100.00 | 0.00 | -100.00 | -0.6791 | ||||
| UNP / Union Pacific Corporation | 0.00 | -100.00 | 0.00 | -100.00 | -0.9121 |