Basic Stats
| Portfolio Value | $ 1,025,461,020 |
| Current Positions | 94 |
Latest Holdings, Performance, AUM (from 13F, 13D)
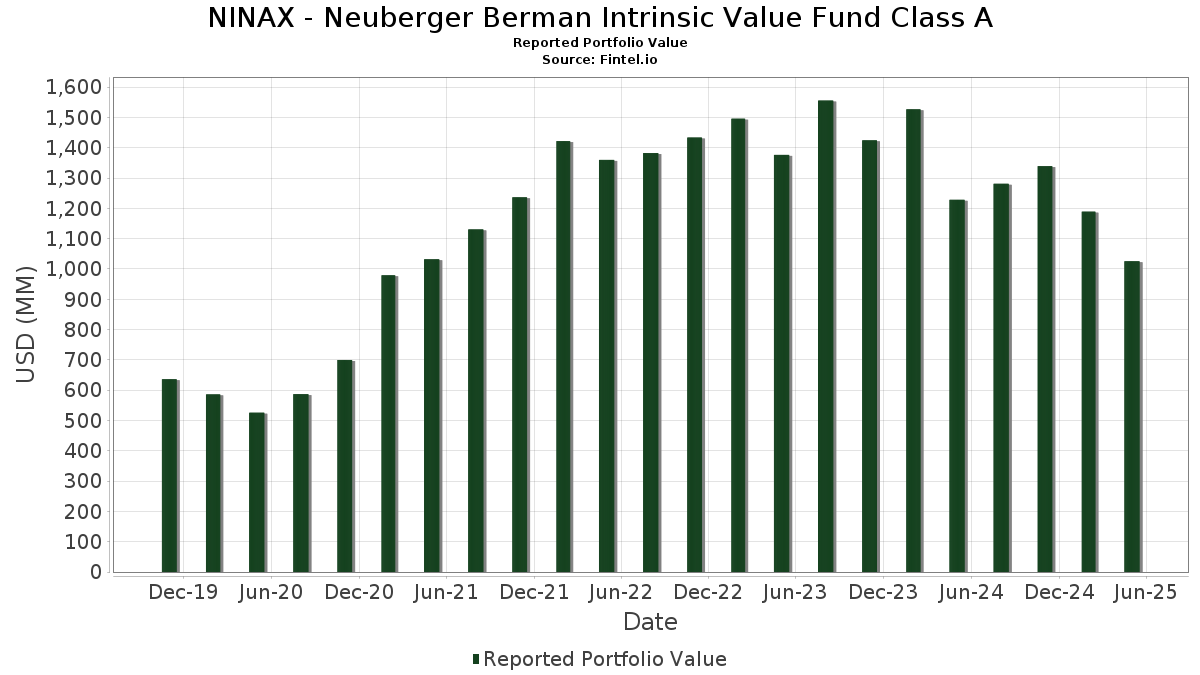
NINAX - Neuberger Berman Intrinsic Value Fund Class A has disclosed 94 total holdings in their latest SEC filings. Most recent portfolio value is calculated to be $ 1,025,461,020 USD. Actual Assets Under Management (AUM) is this value plus cash (which is not disclosed). NINAX - Neuberger Berman Intrinsic Value Fund Class A’s top holdings are Kyndryl Holdings, Inc. (US:KD) , Ciena Corporation (US:CIEN) , AerCap Holdings N.V. (US:AER) , Ormat Technologies, Inc. (US:ORA) , and KBR, Inc. (US:KBR) . NINAX - Neuberger Berman Intrinsic Value Fund Class A’s new positions include Lionsgate Studios Corp. (US:LION) , Glacier Bancorp, Inc. (US:GBCI) , Rogers Corporation (US:ROG) , Starz Entertainment Corp. (US:STRZ) , and Neogen Corporation (US:NEOG) .
Top Increases This Quarter
We use the change in the portfolio allocation because this is the most meaningful metric. Changes can be due to trades or changes in share prices.
| Security | Shares (MM) |
Value (MM$) |
Portfolio % | ΔPortfolio % |
|---|---|---|---|---|
| 3.01 | 21.79 | 2.1249 | 2.1249 | |
| 1.75 | 14.26 | 1.3910 | 0.5803 | |
| 1.55 | 24.21 | 2.3613 | 0.5673 | |
| 0.22 | 18.76 | 1.8295 | 0.5561 | |
| 0.12 | 4.90 | 0.4781 | 0.4781 | |
| 0.17 | 10.94 | 1.0671 | 0.4495 | |
| 1.14 | 44.57 | 4.3460 | 0.4097 | |
| 1.48 | 16.15 | 1.5744 | 0.3772 | |
| 0.40 | 29.58 | 2.8843 | 0.3678 | |
| 0.56 | 29.46 | 2.8732 | 0.3668 |
Top Decreases This Quarter
We use the change in the portfolio allocation because this is the most meaningful metric. Changes can be due to trades or changes in share prices.
| Security | Shares (MM) |
Value (MM$) |
Portfolio % | ΔPortfolio % |
|---|---|---|---|---|
| 0.96 | 24.41 | 2.3805 | -1.0380 | |
| 1.11 | 6.47 | 0.6311 | -0.4585 | |
| 4.37 | 14.76 | 1.4392 | -0.4220 | |
| 3.76 | 8.43 | 0.8217 | -0.3841 | |
| 1.71 | 25.09 | 2.4468 | -0.2917 | |
| 0.21 | 3.97 | 0.3869 | -0.2692 | |
| 0.00 | 0.00 | -0.2613 | ||
| 0.07 | 10.46 | 1.0198 | -0.2561 | |
| 0.05 | 6.73 | 0.6567 | -0.2507 | |
| 0.35 | 7.77 | 0.7575 | -0.2284 |
13F and Fund Filings
This form was filed on 2025-07-28 for the reporting period 2025-05-31. Click the link icon to see the full transaction history.
Upgrade to unlock premium data and export to Excel ![]() .
.
| Security | Type | Avg Share Price | Shares (MM) |
ΔShares (%) |
ΔShares (%) |
Value ($MM) |
Portfolio (%) |
ΔPortfolio (%) |
|
|---|---|---|---|---|---|---|---|---|---|
| KD / Kyndryl Holdings, Inc. | 1.14 | -7.06 | 44.57 | -4.72 | 4.3460 | 0.4097 | |||
| CIEN / Ciena Corporation | 0.43 | -7.06 | 34.51 | -6.49 | 3.3656 | 0.2595 | |||
| AER / AerCap Holdings N.V. | 0.27 | -21.04 | 31.34 | -11.36 | 3.0560 | 0.0805 | |||
| ORA / Ormat Technologies, Inc. | 0.40 | -7.06 | 29.58 | -1.08 | 2.8843 | 0.3678 | |||
| KBR / KBR, Inc. | 0.56 | -7.06 | 29.46 | -1.07 | 2.8732 | 0.3668 | |||
| BRSL / Brightstar Lottery PLC | 1.71 | -7.06 | 25.09 | -22.89 | 2.4468 | -0.2917 | |||
| CRTO / Criteo S.A. - Depositary Receipt (Common Stock) | 0.96 | -8.39 | 24.41 | -39.90 | 2.3805 | -1.0380 | |||
| HBAN / Huntington Bancshares Incorporated | 1.55 | 19.70 | 24.21 | 13.60 | 2.3613 | 0.5673 | |||
| AVY / Avery Dennison Corporation | 0.13 | -7.06 | 22.98 | -12.12 | 2.2411 | 0.0402 | |||
| LION / Lionsgate Studios Corp. | 3.01 | 21.79 | 2.1249 | 2.1249 | |||||
| REZI / Resideo Technologies, Inc. | 1.03 | -20.45 | 21.41 | -14.28 | 2.0879 | -0.0142 | |||
| MTSI / MACOM Technology Solutions Holdings, Inc. | 0.17 | -7.06 | 20.94 | -2.28 | 2.0422 | 0.2387 | |||
| KAR / OPENLANE, Inc. | 0.87 | -23.16 | 20.04 | -20.99 | 1.9539 | -0.1802 | |||
| ATO / Atmos Energy Corporation | 0.13 | -1.77 | 19.39 | -0.13 | 1.8905 | 0.2569 | |||
| RMBS / Rambus Inc. | 0.36 | -6.46 | 19.35 | -10.51 | 1.8867 | 0.0672 | |||
| VECO / Veeco Instruments Inc. | 0.97 | -7.06 | 18.82 | -19.30 | 1.8355 | -0.1275 | |||
| ACA / Arcosa, Inc. | 0.22 | 20.55 | 18.76 | 23.99 | 1.8295 | 0.5561 | |||
| TCBI / Texas Capital Bancshares, Inc. | 0.24 | -7.06 | 17.36 | -15.83 | 1.6927 | -0.0429 | |||
| SGI / Somnigroup International Inc. | 0.26 | -7.06 | 17.01 | -5.34 | 1.6589 | 0.1464 | |||
| FTI / TechnipFMC plc | 0.54 | -14.47 | 16.73 | -9.50 | 1.6312 | 0.0757 | |||
| NWE / NorthWestern Energy Group, Inc. | 0.30 | -0.88 | 16.36 | -1.94 | 1.5951 | 0.1913 | |||
| CGNT / Cognyte Software Ltd. | 1.48 | -7.06 | 16.15 | 13.50 | 1.5744 | 0.3772 | |||
| NJR / New Jersey Resources Corporation | 0.35 | -1.39 | 15.94 | -6.46 | 1.5548 | 0.1202 | |||
| CNX / CNX Resources Corporation | 0.48 | -7.06 | 15.44 | 3.81 | 1.5053 | 0.2539 | |||
| OSIS / OSI Systems, Inc. | 0.07 | -27.82 | 15.21 | -23.31 | 1.4834 | -0.1858 | |||
| MRCY / Mercury Systems, Inc. | 0.30 | -5.35 | 15.00 | 4.97 | 1.4626 | 0.2601 | |||
| POR / Portland General Electric Company | 0.35 | -0.84 | 14.90 | -6.21 | 1.4530 | 0.1159 | |||
| RBBN / Ribbon Communications Inc. | 4.37 | -6.81 | 14.76 | -33.27 | 1.4392 | -0.4220 | |||
| HAE / Haemonetics Corporation | 0.21 | -7.06 | 14.42 | -3.92 | 1.4064 | 0.1431 | |||
| HSC / Enviri Corp | 1.75 | 18.10 | 14.26 | 48.08 | 1.3910 | 0.5803 | |||
| VST / Vistra Corp. | 0.09 | -7.06 | 14.17 | 11.65 | 1.3817 | 0.3137 | |||
| SSYS / Stratasys Ltd. | 1.32 | -7.06 | 13.64 | -9.17 | 1.3300 | 0.0663 | |||
| DVN / Devon Energy Corporation | 0.45 | -7.06 | 13.57 | -22.35 | 1.3236 | -0.1475 | |||
| VRNS / Varonis Systems, Inc. | 0.27 | -7.06 | 13.07 | 3.12 | 1.2749 | 0.2080 | |||
| VSAT / Viasat, Inc. | 1.47 | -7.06 | 12.82 | -7.17 | 1.2501 | 0.0880 | |||
| ADEA / Adeia Inc. | 0.96 | -7.06 | 12.36 | -24.09 | 1.2054 | -0.1650 | |||
| TDY / Teledyne Technologies Incorporated | 0.02 | -7.06 | 12.06 | -9.98 | 1.1765 | 0.0487 | |||
| ITRI / Itron, Inc. | 0.10 | -7.06 | 11.70 | -1.33 | 1.1405 | 0.1429 | |||
| CLH / Clean Harbors, Inc. | 0.05 | -7.06 | 11.34 | -1.30 | 1.1054 | 0.1389 | |||
| IPGP / IPG Photonics Corporation | 0.17 | 30.96 | 10.94 | 49.13 | 1.0671 | 0.4495 | |||
| WIX / Wix.com Ltd. | 0.07 | -7.06 | 10.46 | -31.02 | 1.0198 | -0.2561 | |||
| BANC / Banc of California, Inc. | 0.72 | 13.58 | 9.87 | 4.79 | 0.9627 | 0.1699 | |||
| PATH / UiPath Inc. | 0.68 | -6.71 | 9.00 | 0.94 | 0.8781 | 0.1274 | |||
| ATRC / AtriCure, Inc. | 0.26 | -6.91 | 8.82 | -16.93 | 0.8600 | -0.0334 | |||
| BE / Bloom Energy Corporation | 0.47 | -5.35 | 8.72 | -27.22 | 0.8502 | -0.1579 | |||
| CNDT / Conduent Incorporated | 3.76 | -7.06 | 8.43 | -41.19 | 0.8217 | -0.3841 | |||
| ALIT / Alight, Inc. | 1.52 | 9.29 | 8.32 | -12.63 | 0.8112 | 0.0099 | |||
| THS / TreeHouse Foods, Inc. | 0.35 | -7.06 | 7.77 | -33.69 | 0.7575 | -0.2284 | |||
| UIS / Unisys Corporation | 1.58 | -7.06 | 7.55 | 2.86 | 0.7363 | 0.1185 | |||
| ACHC / Acadia Healthcare Company, Inc. | 0.33 | -7.06 | 7.50 | -29.82 | 0.7316 | -0.1680 | |||
| RDWR / Radware Ltd. | 0.32 | -7.06 | 7.40 | 0.15 | 0.7215 | 0.0998 | |||
| WHR / Whirlpool Corporation | 0.09 | 12.89 | 7.27 | -13.38 | 0.7088 | 0.0025 | |||
| AMRX / Amneal Pharmaceuticals, Inc. | 0.98 | -7.06 | 7.19 | -21.53 | 0.7011 | -0.0700 | |||
| BOX / Box, Inc. | 0.18 | -7.06 | 6.99 | 7.49 | 0.6820 | 0.1345 | |||
| OSPN / OneSpan Inc. | 0.44 | -7.06 | 6.93 | -7.70 | 0.6761 | 0.0440 | |||
| SMTC / Semtech Corporation | 0.18 | 18.20 | 6.76 | 15.53 | 0.6595 | 0.1669 | |||
| CRL / Charles River Laboratories International, Inc. | 0.05 | -23.87 | 6.73 | -37.54 | 0.6567 | -0.2507 | |||
| UA / Under Armour, Inc. | 1.06 | -7.06 | 6.69 | -7.80 | 0.6526 | 0.0418 | |||
| CLF / Cleveland-Cliffs Inc. | 1.11 | -7.06 | 6.47 | -50.02 | 0.6311 | -0.4585 | |||
| ADS / Bread Financial Holdings Inc | 0.12 | -7.06 | 6.16 | -11.81 | 0.6009 | 0.0129 | |||
| VIAV / Viavi Solutions Inc. | 0.67 | -7.06 | 6.14 | -24.27 | 0.5991 | -0.0836 | |||
| XPER / Xperi Inc. | 0.77 | -7.06 | 6.00 | -14.43 | 0.5854 | -0.0049 | |||
| VRNT / Verint Systems Inc. | 0.34 | -7.06 | 6.00 | -27.78 | 0.5847 | -0.1139 | |||
| TTI / TETRA Technologies, Inc. | 2.11 | -7.06 | 5.66 | -34.28 | 0.5523 | -0.1730 | |||
| LASR / nLIGHT, Inc. | 0.37 | -7.06 | 5.58 | 53.35 | 0.5444 | 0.2380 | |||
| COHR / Coherent Corp. | 0.07 | 12.95 | 5.51 | 13.61 | 0.5372 | 0.1291 | |||
| GBCI / Glacier Bancorp, Inc. | 0.12 | 4.90 | 0.4781 | 0.4781 | |||||
| PRKS / United Parks & Resorts Inc. | 0.11 | -7.06 | 4.84 | -17.57 | 0.4721 | -0.0222 | |||
| CNMD / CONMED Corporation | 0.08 | -7.06 | 4.80 | -10.87 | 0.4678 | 0.0149 | |||
| HLIO / Helios Technologies, Inc. | 0.14 | -7.06 | 4.28 | -28.56 | 0.4178 | -0.0870 | |||
| ODP / The ODP Corporation | 0.25 | -7.06 | 4.17 | -1.74 | 0.4068 | 0.0495 | |||
| INDI / indie Semiconductor, Inc. | 1.50 | -7.06 | 3.97 | -18.18 | 0.3875 | -0.0212 | |||
| CEVA / CEVA, Inc. | 0.21 | -7.06 | 3.97 | -49.11 | 0.3869 | -0.2692 | |||
| PTEN / Patterson-UTI Energy, Inc. | 0.69 | -7.06 | 3.82 | -38.27 | 0.3721 | -0.1480 | |||
| ZIMV / ZimVie Inc. | 0.40 | -7.06 | 3.64 | -35.99 | 0.3549 | -0.1236 | |||
| CAL / Caleres, Inc. | 0.27 | -7.06 | 3.63 | -22.65 | 0.3537 | -0.0409 | |||
| OSUR / OraSure Technologies, Inc. | 1.15 | -4.99 | 3.32 | -21.37 | 0.3236 | -0.0316 | |||
| IART / Integra LifeSciences Holdings Corporation | 0.25 | -7.06 | 3.17 | -49.31 | 0.3087 | -0.2168 | |||
| INVX / Innovex International, Inc. | 0.22 | -7.06 | 3.09 | -29.95 | 0.3008 | -0.0698 | |||
| VREX / Varex Imaging Corporation | 0.40 | 26.47 | 3.06 | -24.57 | 0.2979 | -0.0429 | |||
| LEA / Lear Corporation | 0.03 | -7.06 | 2.95 | -10.59 | 0.2875 | 0.0100 | |||
| ROG / Rogers Corporation | 0.04 | 2.70 | 0.2632 | 0.2632 | |||||
| QDEL / QuidelOrtho Corporation | 0.09 | -7.06 | 2.67 | -28.74 | 0.2603 | -0.0548 | |||
| STRZ / Starz Entertainment Corp. | 0.12 | 2.58 | 0.2517 | 0.2517 | |||||
| ARAY / Accuray Incorporated | 1.47 | -7.06 | 2.25 | -29.26 | 0.2191 | -0.0482 | |||
| NEOG / Neogen Corporation | 0.32 | 1.86 | 0.1815 | 0.1815 | |||||
| TRIXX / State Street Institutional Investment Trust - State Street Institutional Treasury Fund Institutional Class | 1.79 | -1.39 | 1.79 | -1.43 | 0.1750 | 0.0219 | |||
| RBBN / Ribbon Communications Inc. | 1.51 | 1.68 | 0.1637 | 0.1637 | |||||
| HAIN / The Hain Celestial Group, Inc. | 0.71 | -7.06 | 1.32 | -51.47 | 0.1289 | -0.1002 | |||
| BW / Babcock & Wilcox Enterprises, Inc. | 1.77 | -7.06 | 1.24 | -39.96 | 0.1205 | -0.0526 | |||
| INVZ / Innoviz Technologies Ltd | 1.31 | -7.06 | 1.19 | 14.53 | 0.1160 | 0.0285 | |||
| HLIT / Harmonic Inc. | 0.13 | -7.06 | 1.13 | -18.72 | 0.1102 | -0.0068 | |||
| LAB / Standard BioTools Inc. | 1.08 | -7.06 | 1.09 | -11.86 | 0.1065 | 0.0022 | |||
| CTSO / Cytosorbents Corporation | 0.67 | -7.06 | 0.57 | -26.40 | 0.0553 | -0.0095 | |||
| CTSO / Cytosorbents Corporation | 0.13 | 0.00 | 0.0000 | 0.0000 | |||||
| CTSO / Cytosorbents Corporation | 0.13 | 0.00 | 0.0000 | 0.0000 | |||||
| CTSO / Cytosorbents Corporation | 0.13 | 0.00 | 0.0000 | 0.0000 | |||||
| FLYW / Flywire Corporation | 0.00 | -100.00 | 0.00 | -100.00 | -0.2613 |