Basic Stats
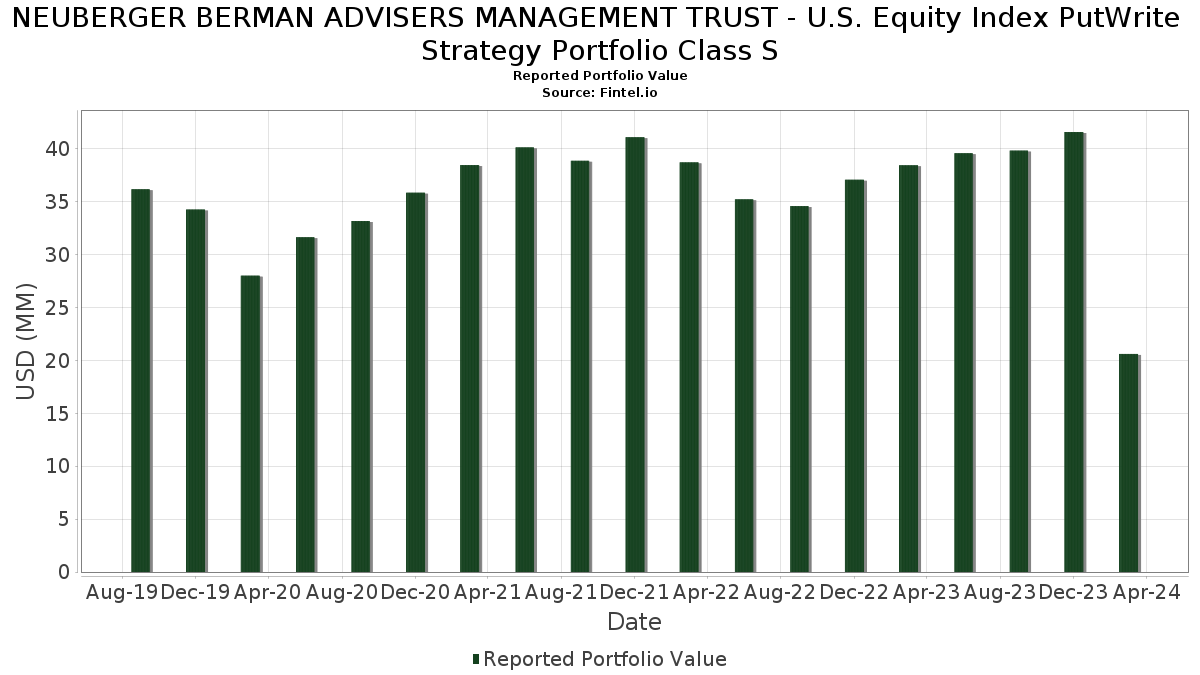
| Portfolio Value | $ 20,611,589 |
| Current Positions | 21 |
Latest Holdings, Performance, AUM (from 13F, 13D)
NEUBERGER BERMAN ADVISERS MANAGEMENT TRUST - U.S. Equity Index PutWrite Strategy Portfolio Class S has disclosed 21 total holdings in their latest SEC filings. Most recent portfolio value is calculated to be $ 20,611,589 USD. Actual Assets Under Management (AUM) is this value plus cash (which is not disclosed). NEUBERGER BERMAN ADVISERS MANAGEMENT TRUST - U.S. Equity Index PutWrite Strategy Portfolio Class S’s top holdings are FANNIE MAE 1.625% 10/15/2024 (US:US3135G0W660) , U.S. Treasury Notes (US:US91282CCX74) , United States Treasury Note/Bond (US:US91282CED92) , Federal Home Loan Mortgage Corp (US:US3134GY2K76) , and Federal Home Loan Banks (US:US3130ASME60) . NEUBERGER BERMAN ADVISERS MANAGEMENT TRUST - U.S. Equity Index PutWrite Strategy Portfolio Class S’s new positions include FANNIE MAE 1.625% 10/15/2024 (US:US3135G0W660) , U.S. Treasury Notes (US:US91282CCX74) , United States Treasury Note/Bond (US:US91282CED92) , Federal Home Loan Mortgage Corp (US:US3134GY2K76) , and Federal Home Loan Banks (US:US3130ASME60) .
Top Increases This Quarter
We use the change in the portfolio allocation because this is the most meaningful metric. Changes can be due to trades or changes in share prices.
| Security | Shares (MM) |
Value (MM$) |
Portfolio % | ΔPortfolio % |
|---|---|---|---|---|
| 3.00 | 14.4283 | 14.4283 | ||
| 2.19 | 10.5156 | 10.5156 | ||
| 3.91 | 18.8220 | 9.6086 | ||
| 3.92 | 18.8759 | 9.6047 | ||
| 3.59 | 17.2519 | 8.7484 | ||
| 0.97 | 4.6711 | 4.6711 | ||
| 0.83 | 0.83 | 3.9765 | 3.9765 | |
| 1.29 | 6.2069 | 3.1451 | ||
| 1.00 | 4.7874 | 2.4220 |
Top Decreases This Quarter
We use the change in the portfolio allocation because this is the most meaningful metric. Changes can be due to trades or changes in share prices.
| Security | Shares (MM) |
Value (MM$) |
Portfolio % | ΔPortfolio % |
|---|---|---|---|---|
| -0.04 | -0.2049 | -0.2049 | ||
| -0.01 | -0.0495 | -0.0495 | ||
| -0.00 | -0.0222 | -0.0222 | ||
| -0.00 | -0.0213 | -0.0213 | ||
| -0.00 | -0.0211 | -0.0211 | ||
| -0.00 | -0.0174 | -0.0174 | ||
| -0.00 | -0.0169 | -0.0169 | ||
| -0.00 | -0.0156 | -0.0156 | ||
| -0.00 | -0.0119 | -0.0119 | ||
| -0.00 | -0.0092 | -0.0092 |
13F and Fund Filings
This form was filed on 2024-05-24 for the reporting period 2024-03-31. Click the link icon to see the full transaction history.
Upgrade to unlock premium data and export to Excel ![]() .
.
| Security | Type | Avg Share Price | Shares (MM) |
ΔShares (%) |
ΔShares (%) |
Value ($MM) |
Portfolio (%) |
ΔPortfolio (%) |
|
|---|---|---|---|---|---|---|---|---|---|
| US3135G0W660 / FANNIE MAE 1.625% 10/15/2024 | 3.92 | 0.67 | 18.8759 | 9.6047 | |||||
| US91282CCX74 / U.S. Treasury Notes | 3.91 | 1.03 | 18.8220 | 9.6086 | |||||
| US91282CED92 / United States Treasury Note/Bond | 3.59 | 0.31 | 17.2519 | 8.7484 | |||||
| US3134GY2K76 / Federal Home Loan Mortgage Corp | 3.00 | 14.4283 | 14.4283 | ||||||
| US3130ASME60 / Federal Home Loan Banks | 2.19 | 10.5156 | 10.5156 | ||||||
| US3133ENJ841 / Federal Farm Credit Banks Funding Corp | 1.29 | 0.23 | 6.2069 | 3.1451 | |||||
| US3133ENP798 / Federal Farm Credit Banks Funding Corp | 1.00 | 0.10 | 4.7874 | 2.4220 | |||||
| AGM.PRH / Federal Agricultural Mortgage Corporation - Preferred Stock | 0.97 | 4.6711 | 4.6711 | ||||||
| Invesco Government & Agency Portfolio, Institutional Class / STIV (N/A) | 0.83 | 0.83 | 3.9765 | 3.9765 | |||||
| TBRA / Tobira Therapeutics, Inc. | 0.00 | 0.00 | 0.00 | 0.0000 | 0.0000 | ||||
| S&P 500 Index / DE (N/A) | -0.00 | -0.0001 | -0.0001 | ||||||
| S&P 500 Index / DE (N/A) | -0.00 | -0.0025 | -0.0025 | ||||||
| S&P 500 Index / DE (N/A) | -0.00 | -0.0092 | -0.0092 | ||||||
| S&P 500 Index / DE (N/A) | -0.00 | -0.0119 | -0.0119 | ||||||
| S&P 500 Index / DE (N/A) | -0.00 | -0.0156 | -0.0156 | ||||||
| S&P 500 Index / DE (N/A) | -0.00 | -0.0169 | -0.0169 | ||||||
| S&P 500 Index / DE (N/A) | -0.00 | -0.0174 | -0.0174 | ||||||
| S&P 500 Index / DE (N/A) | -0.00 | -0.0211 | -0.0211 | ||||||
| S&P 500 Index / DE (N/A) | -0.00 | -0.0213 | -0.0213 | ||||||
| S&P 500 Index / DE (N/A) | -0.00 | -0.0222 | -0.0222 | ||||||
| S&P 500 Index / DE (N/A) | -0.01 | -0.0495 | -0.0495 | ||||||
| S&P 500 Index / DE (US00PB6ZC115) | -0.04 | -0.2049 | -0.2049 |