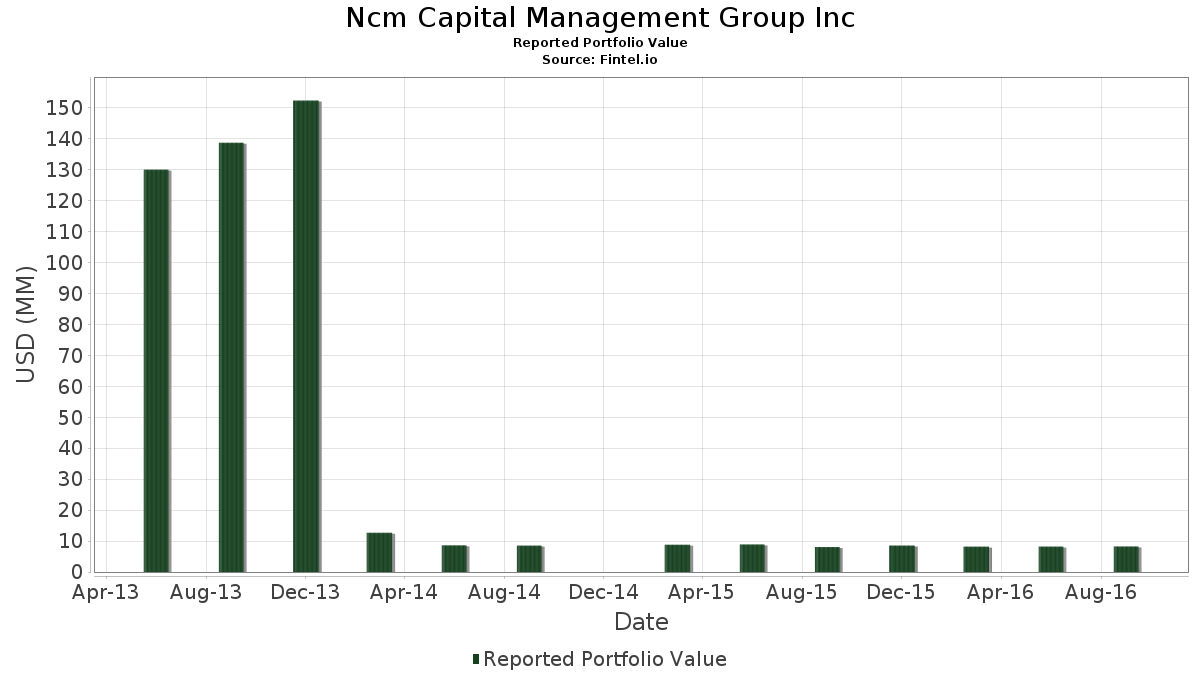
Basic Stats
| Portfolio Value | $ 8,239,000 |
| Current Positions | 80 |
Latest Holdings, Performance, AUM (from 13F, 13D)
Ncm Capital Management Group Inc has disclosed 80 total holdings in their latest SEC filings. Most recent portfolio value is calculated to be $ 8,239,000 USD. Actual Assets Under Management (AUM) is this value plus cash (which is not disclosed). Ncm Capital Management Group Inc’s top holdings are JPMorgan Chase & Co. (US:JPM) , General Electric Company (US:GE) , Berkshire Hathaway Inc. (US:BRK.B) , AT&T Inc. (US:T) , and The Procter & Gamble Company (US:PG) . Ncm Capital Management Group Inc’s new positions include Weyerhaeuser Company (US:WY) , Dell Technologies Inc. (US:DELL) , .
Top Increases This Quarter
We use the change in the portfolio allocation because this is the most meaningful metric. Changes can be due to trades or changes in share prices.
| Security | Shares (MM) |
Value (MM$) |
Portfolio % | ΔPortfolio % |
|---|---|---|---|---|
| 0.00 | 0.06 | 0.7647 | 0.7647 | |
| 0.00 | 0.06 | 0.7525 | 0.7525 | |
| 0.00 | 0.06 | 0.7282 | 0.7282 | |
| 0.00 | 0.18 | 2.1483 | 0.6492 | |
| 0.00 | 0.04 | 0.5219 | 0.5219 | |
| 0.00 | 0.04 | 0.4976 | 0.4976 | |
| 0.00 | 0.18 | 2.1969 | 0.4784 | |
| 0.00 | 0.04 | 0.4491 | 0.4491 | |
| 0.00 | 0.20 | 2.4760 | 0.3797 | |
| 0.01 | 0.39 | 4.6850 | 0.2975 |
Top Decreases This Quarter
We use the change in the portfolio allocation because this is the most meaningful metric. Changes can be due to trades or changes in share prices.
| Security | Shares (MM) |
Value (MM$) |
Portfolio % | ΔPortfolio % |
|---|---|---|---|---|
| 0.00 | 0.09 | 1.0560 | -0.8210 | |
| 0.00 | 0.00 | -0.8166 | ||
| 0.00 | 0.05 | 0.6311 | -0.5998 | |
| 0.01 | 0.16 | 1.9784 | -0.4835 | |
| 0.00 | 0.16 | 1.9298 | -0.2639 | |
| 0.01 | 0.29 | 3.5320 | -0.2340 | |
| 0.01 | 0.24 | 2.9251 | -0.1949 | |
| 0.00 | 0.19 | 2.3182 | -0.1924 | |
| 0.00 | 0.19 | 2.3304 | -0.1681 | |
| 0.00 | 0.17 | 2.0876 | -0.1671 |
13F and Fund Filings
This form was filed on 2016-11-07 for the reporting period 2016-09-30. Click the link icon to see the full transaction history.
Upgrade to unlock premium data and export to Excel ![]() .
.
| Security | Type | Avg Share Price | Shares (MM) |
ΔShares (%) |
ΔShares (%) |
Value ($MM) |
Portfolio (%) |
ΔPortfolio (%) |
|
|---|---|---|---|---|---|---|---|---|---|
| JPM / JPMorgan Chase & Co. | 0.01 | 0.00 | 0.39 | 7.22 | 4.6850 | 0.2975 | |||
| GE / General Electric Company | 0.01 | -0.06 | 0.29 | -5.83 | 3.5320 | -0.2340 | |||
| BRK.B / Berkshire Hathaway Inc. | 0.00 | 0.00 | 0.28 | -0.36 | 3.3742 | -0.0262 | |||
| T / AT&T Inc. | 0.01 | 0.00 | 0.24 | -5.86 | 2.9251 | -0.1949 | |||
| PG / The Procter & Gamble Company | 0.00 | 0.00 | 0.23 | 5.91 | 2.8280 | 0.1467 | |||
| US0325111070 / Anadarko Petroleum Corp. | 0.00 | 0.00 | 0.20 | 18.60 | 2.4760 | 0.3797 | |||
| WFC / Wells Fargo & Company | 0.00 | 0.00 | 0.19 | -6.34 | 2.3304 | -0.1681 | |||
| CVS / CVS Health Corporation | 0.00 | 0.00 | 0.19 | -7.28 | 2.3182 | -0.1924 | |||
| TWX / Warner Media LLC | 0.00 | 0.00 | 0.18 | 8.28 | 2.2211 | 0.1614 | |||
| PNC / The PNC Financial Services Group, Inc. | 0.00 | 0.00 | 0.18 | 10.30 | 2.2090 | 0.1980 | |||
| COF / Capital One Financial Corporation | 0.00 | 13.48 | 0.18 | 28.37 | 2.1969 | 0.4784 | |||
| STI / Solidion Technology, Inc. | 0.00 | 35.00 | 0.18 | 43.90 | 2.1483 | 0.6492 | |||
| XOM / Exxon Mobil Corporation | 0.00 | 0.00 | 0.17 | -7.03 | 2.0876 | -0.1671 | |||
| INTC / Intel Corporation | 0.00 | 0.00 | 0.17 | 15.17 | 2.0269 | 0.2597 | |||
| SLB / Schlumberger Limited | 0.00 | 0.00 | 0.17 | -0.60 | 2.0027 | -0.0205 | |||
| CSCO / Cisco Systems, Inc. | 0.01 | 0.00 | 0.17 | 10.74 | 2.0027 | 0.1867 | |||
| KR / The Kroger Co. | 0.01 | 0.00 | 0.16 | -19.31 | 1.9784 | -0.4835 | |||
| PRU / Prudential Financial, Inc. | 0.00 | 0.00 | 0.16 | 14.18 | 1.9541 | 0.2357 | |||
| L / Loews Corporation | 0.00 | -11.43 | 0.16 | -11.67 | 1.9298 | -0.2639 | |||
| UNH / UnitedHealth Group Incorporated | 0.00 | 0.00 | 0.15 | -0.65 | 1.8692 | -0.0199 | |||
| ALB / Albemarle Corporation | 0.00 | 0.00 | 0.15 | 7.91 | 1.8206 | 0.1265 | |||
| VZ / Verizon Communications Inc. | 0.00 | 0.00 | 0.14 | -6.71 | 1.6871 | -0.1289 | |||
| CCL / Carnival Corporation & plc | 0.00 | 9.90 | 0.14 | 20.54 | 1.6385 | 0.2735 | |||
| EXC / Exelon Corporation | 0.00 | 0.00 | 0.13 | -8.39 | 1.5900 | -0.1528 | |||
| VLO / Valero Energy Corporation | 0.00 | 0.00 | 0.13 | 4.10 | 1.5414 | 0.0546 | |||
| GILD / Gilead Sciences, Inc. | 0.00 | 0.00 | 0.13 | -5.26 | 1.5293 | -0.0917 | |||
| JNJ / Johnson & Johnson | 0.00 | 0.00 | 0.12 | -2.36 | 1.5050 | -0.0428 | |||
| ORCL / Oracle Corporation | 0.00 | 0.00 | 0.12 | -4.00 | 1.4565 | -0.0670 | |||
| DAL / Delta Air Lines, Inc. | 0.00 | 0.00 | 0.12 | 8.26 | 1.4322 | 0.1038 | |||
| AAP / Advance Auto Parts, Inc. | 0.00 | 0.00 | 0.11 | -7.44 | 1.3594 | -0.1153 | |||
| PCG / PG&E Corporation | 0.00 | 0.00 | 0.11 | -4.35 | 1.3351 | -0.0665 | |||
| SRE / Sempra | 0.00 | 0.00 | 0.11 | -6.14 | 1.2987 | -0.0907 | |||
| PEP / PepsiCo, Inc. | 0.00 | 0.00 | 0.10 | 3.06 | 1.2259 | 0.0315 | |||
| PFE / Pfizer Inc. | 0.00 | 0.00 | 0.10 | -4.04 | 1.1531 | -0.0535 | |||
| PVH / PVH Corp. | 0.00 | -15.00 | 0.09 | 0.00 | 1.1409 | -0.0047 | |||
| WBA / Walgreens Boots Alliance, Inc. | 0.00 | 0.00 | 0.09 | -3.12 | 1.1288 | -0.0412 | |||
| FDX / FedEx Corporation | 0.00 | 0.00 | 0.09 | 15.00 | 1.1166 | 0.1416 | |||
| LMT / Lockheed Martin Corporation | 0.00 | 0.00 | 0.09 | -3.23 | 1.0924 | -0.0411 | |||
| CMS / CMS Energy Corporation | 0.00 | 0.00 | 0.09 | -8.25 | 1.0802 | -0.1020 | |||
| NTRS / Northern Trust Corporation | 0.00 | -45.16 | 0.09 | -43.51 | 1.0560 | -0.8210 | |||
| URI / United Rentals, Inc. | 0.00 | 0.00 | 0.08 | 17.14 | 0.9953 | 0.1421 | |||
| RTX / RTX Corporation | 0.00 | 0.00 | 0.08 | -1.22 | 0.9831 | -0.0163 | |||
| ABT / Abbott Laboratories | 0.00 | 0.00 | 0.08 | 6.67 | 0.9710 | 0.0569 | |||
| FTI / TechnipFMC plc | 0.00 | 0.00 | 0.08 | 11.59 | 0.9346 | 0.0936 | |||
| MCK / McKesson Corporation | 0.00 | 0.00 | 0.07 | -10.71 | 0.9103 | -0.1135 | |||
| LOW / Lowe's Companies, Inc. | 0.00 | 0.00 | 0.07 | -8.64 | 0.8982 | -0.0890 | |||
| PNW / Pinnacle West Capital Corporation | 0.00 | 0.00 | 0.07 | -6.67 | 0.8496 | -0.0645 | |||
| BDX / Becton, Dickinson and Company | 0.00 | 0.00 | 0.07 | 6.15 | 0.8375 | 0.0453 | |||
| EMN / Eastman Chemical Company | 0.00 | 0.00 | 0.07 | 0.00 | 0.8011 | -0.0033 | |||
| BHI / Baker Hughes Inc. | 0.00 | 0.00 | 0.06 | 12.50 | 0.7647 | 0.7647 | |||
| SCS / Steelcase Inc. | 0.00 | 0.00 | 0.06 | 3.33 | 0.7525 | 0.7525 | |||
| GS / The Goldman Sachs Group, Inc. | 0.00 | 0.00 | 0.06 | 7.14 | 0.7282 | 0.0457 | |||
| WMB / The Williams Companies, Inc. | 0.00 | 0.00 | 0.06 | 42.86 | 0.7282 | 0.7282 | |||
| CELG / Celgene Corp. | 0.00 | 0.00 | 0.06 | 5.26 | 0.7282 | 0.0335 | |||
| OII / Oceaneering International, Inc. | 0.00 | 0.00 | 0.06 | -7.94 | 0.7040 | -0.0639 | |||
| MAS / Masco Corporation | 0.00 | 0.00 | 0.06 | 10.00 | 0.6676 | 0.0582 | |||
| CRS / Carpenter Technology Corporation | 0.00 | 0.00 | 0.05 | 26.19 | 0.6433 | 0.1314 | |||
| MMC / Marsh & McLennan Companies, Inc. | 0.00 | -47.46 | 0.05 | -48.51 | 0.6311 | -0.5998 | |||
| SPG / Simon Property Group, Inc. | 0.00 | 0.00 | 0.05 | -4.08 | 0.5705 | -0.0267 | |||
| UHS / Universal Health Services, Inc. | 0.00 | 0.00 | 0.05 | -8.00 | 0.5583 | -0.0511 | |||
| US00C4U1L353 / Mylan N.V. | 0.00 | 0.00 | 0.04 | -12.24 | 0.5219 | -0.0753 | |||
| WY / Weyerhaeuser Company | 0.00 | 0.04 | 0.5219 | 0.5219 | |||||
| US6550441058 / Noble Energy, Inc. | 0.00 | 0.00 | 0.04 | 0.00 | 0.4976 | -0.0021 | |||
| UNP / Union Pacific Corporation | 0.00 | 0.00 | 0.04 | 10.81 | 0.4976 | 0.0467 | |||
| COG / Cabot Oil & Gas Corp. | 0.00 | 0.00 | 0.04 | 0.00 | 0.4976 | 0.4976 | |||
| IBM / International Business Machines Corporation | 0.00 | 0.00 | 0.04 | 5.26 | 0.4855 | 0.0224 | |||
| DOV / Dover Corporation | 0.00 | 0.00 | 0.04 | 5.56 | 0.4612 | 0.0225 | |||
| LVLT / Level 3 Financing Inc. - Corporate Bond/Note | 0.00 | 0.00 | 0.04 | -9.76 | 0.4491 | 0.4491 | |||
| THC / Tenet Healthcare Corporation | 0.00 | 0.00 | 0.04 | -19.57 | 0.4491 | -0.1116 | |||
| EXPD / Expeditors International of Washington, Inc. | 0.00 | 0.00 | 0.04 | 5.71 | 0.4491 | 0.0225 | |||
| J / Jacobs Solutions Inc. | 0.00 | 0.00 | 0.04 | 2.86 | 0.4369 | 0.0104 | |||
| HPE / Hewlett Packard Enterprise Company | 0.00 | 0.00 | 0.04 | 24.14 | 0.4369 | 0.0835 | |||
| 61166W101 / Monsanto Co. | 0.00 | 0.00 | 0.03 | -2.94 | 0.4005 | -0.0138 | |||
| TSL / GraniteShares ETF Trust - GraniteShares 1.25x Long TSLA Daily ETF | 0.00 | 0.00 | 0.03 | 31.82 | 0.3520 | 0.0839 | |||
| VIAV / Viavi Solutions Inc. | 0.00 | 0.00 | 0.03 | 12.00 | 0.3398 | 0.0352 | |||
| ARNC / Arconic Corporation | 0.00 | 0.00 | 0.02 | 9.09 | 0.2913 | 0.0232 | |||
| HPQ / HP Inc. | 0.00 | 0.00 | 0.02 | 26.32 | 0.2913 | 0.0597 | |||
| CF / CF Industries Holdings, Inc. | 0.00 | 0.00 | 0.02 | 0.00 | 0.2670 | -0.0011 | |||
| DVA / DaVita Inc. | 0.00 | 0.00 | 0.02 | -16.00 | 0.2549 | -0.0498 | |||
| DELL / Dell Technologies Inc. | 0.00 | 0.01 | 0.1578 | 0.1578 | |||||
| EMC / Global X Funds - Global X Emerging Markets Great Consumer ETF | 0.00 | -100.00 | 0.00 | -100.00 | -0.8166 |