Basic Stats
| Portfolio Value | $ 1,293,026,756 |
| Current Positions | 220 |
Latest Holdings, Performance, AUM (from 13F, 13D)
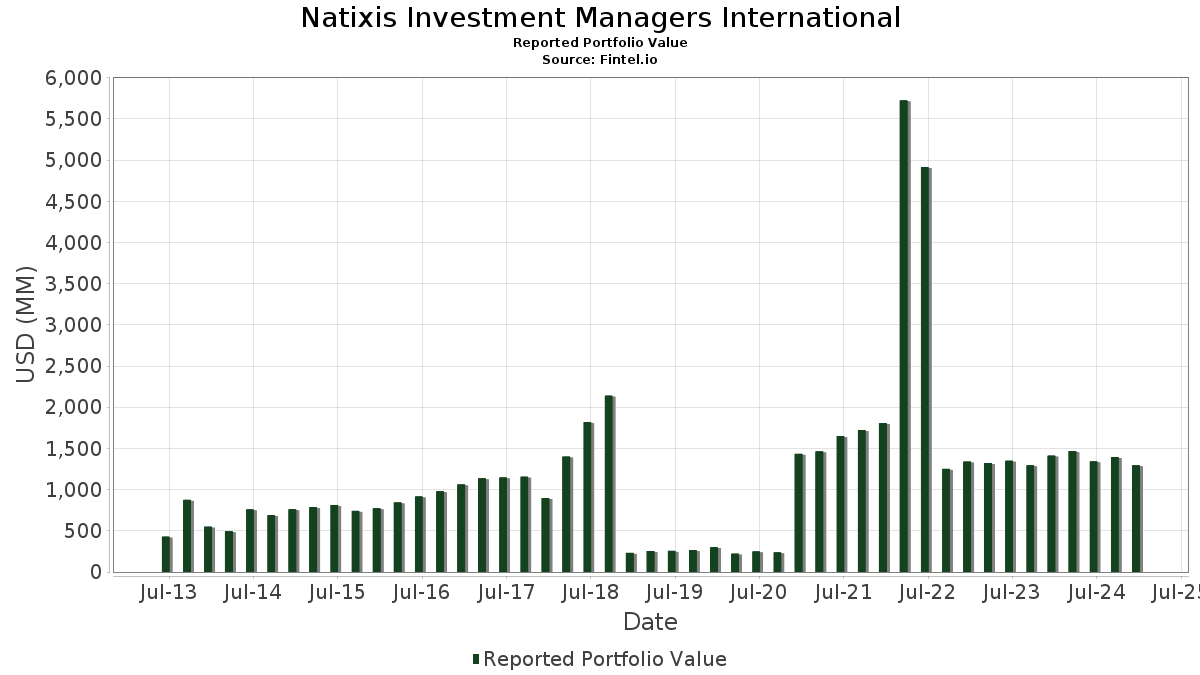
Natixis Investment Managers International has disclosed 220 total holdings in their latest SEC filings. Most recent portfolio value is calculated to be $ 1,293,026,756 USD. Actual Assets Under Management (AUM) is this value plus cash (which is not disclosed). Natixis Investment Managers International’s top holdings are The Procter & Gamble Company (US:PG) , Eli Lilly and Company (US:LLY) , NVIDIA Corporation (US:NVDA) , Microsoft Corporation (US:MSFT) , and Amazon.com, Inc. (US:AMZN) . Natixis Investment Managers International’s new positions include Aptiv PLC (US:APTV) , Grab Holdings Limited (US:GRAB) , Blue Owl Capital Inc. (US:OWL) , Lincoln Electric Holdings, Inc. (US:LECO) , and Celestica Inc. (US:CLS) .
Top Increases This Quarter
We use the change in the portfolio allocation because this is the most meaningful metric. Changes can be due to trades or changes in share prices.
| Security | Shares (MM) |
Value (MM$) |
Portfolio % | ΔPortfolio % |
|---|---|---|---|---|
| 0.05 | 32.01 | 2.4753 | 2.4753 | |
| 0.29 | 63.33 | 4.8978 | 0.9753 | |
| 0.62 | 82.73 | 6.3980 | 0.9053 | |
| 0.38 | 42.11 | 3.2565 | 0.6043 | |
| 0.04 | 37.98 | 2.9370 | 0.5968 | |
| 0.18 | 30.27 | 2.3414 | 0.4638 | |
| 0.07 | 27.57 | 2.1322 | 0.3696 | |
| 0.08 | 26.40 | 2.0415 | 0.3176 | |
| 0.62 | 103.73 | 8.0223 | 0.3071 | |
| 0.07 | 33.40 | 2.5833 | 0.2902 |
Top Decreases This Quarter
We use the change in the portfolio allocation because this is the most meaningful metric. Changes can be due to trades or changes in share prices.
| Security | Shares (MM) |
Value (MM$) |
Portfolio % | ΔPortfolio % |
|---|---|---|---|---|
| 0.06 | 37.73 | 2.9182 | -1.4413 | |
| 0.02 | 9.14 | 0.7065 | -1.4382 | |
| 0.00 | 0.00 | -1.3449 | ||
| 0.28 | 17.39 | 1.3453 | -1.3312 | |
| 0.21 | 34.04 | 2.6323 | -0.7179 | |
| 0.12 | 89.82 | 6.9461 | -0.5445 | |
| 0.05 | 16.50 | 1.2764 | -0.3556 | |
| 0.13 | 30.29 | 2.3422 | -0.3463 | |
| 0.14 | 34.18 | 2.6433 | -0.2916 | |
| 0.05 | 16.26 | 1.2575 | -0.1715 |
13F and Fund Filings
This form was filed on 2025-02-13 for the reporting period 2024-12-31. Click the link icon to see the full transaction history.
Upgrade to unlock premium data and export to Excel ![]() .
.
| Security | Type | Avg Share Price | Shares (MM) |
ΔShares (%) |
ΔShares (%) |
Value ($MM) |
Portfolio (%) |
ΔPortfolio (%) |
|
|---|---|---|---|---|---|---|---|---|---|
| PG / The Procter & Gamble Company | 0.62 | -0.40 | 103.73 | -3.59 | 8.0223 | 0.3071 | |||
| LLY / Eli Lilly and Company | 0.12 | -1.33 | 89.82 | -14.02 | 6.9461 | -0.5445 | |||
| NVDA / NVIDIA Corporation | 0.62 | -2.33 | 82.73 | 8.00 | 6.3980 | 0.9053 | |||
| MSFT / Microsoft Corporation | 0.18 | -2.13 | 74.13 | -4.13 | 5.7330 | 0.1883 | |||
| AMZN / Amazon.com, Inc. | 0.29 | -1.67 | 63.33 | 15.77 | 4.8978 | 0.9753 | |||
| GOOGL / Alphabet Inc. | 0.25 | -12.75 | 47.37 | -0.42 | 3.6638 | 0.2525 | |||
| DIS / The Walt Disney Company | 0.38 | -1.66 | 42.11 | 13.84 | 3.2565 | 0.6043 | |||
| ICE / Intercontinental Exchange, Inc. | 0.26 | -1.66 | 39.43 | -8.78 | 3.0495 | -0.0503 | |||
| NOW / ServiceNow, Inc. | 0.04 | -1.83 | 37.98 | 16.36 | 2.9370 | 0.5968 | |||
| MPWR / Monolithic Power Systems, Inc. | 0.06 | -3.03 | 37.73 | -37.94 | 2.9182 | -1.4413 | |||
| JPM / JPMorgan Chase & Co. | 0.14 | -26.54 | 34.18 | -16.49 | 2.6433 | -0.2916 | |||
| ZTS / Zoetis Inc. | 0.21 | -12.64 | 34.04 | -27.15 | 2.6323 | -0.7179 | |||
| PPG / PPG Industries, Inc. | 0.28 | -3.22 | 33.78 | -12.72 | 2.6126 | -0.1629 | |||
| SAIA / Saia, Inc. | 0.07 | 0.22 | 33.40 | 4.45 | 2.5833 | 0.2902 | |||
| META / Meta Platforms, Inc. | 0.05 | 32.01 | 2.4753 | 2.4753 | |||||
| TXN / Texas Instruments Incorporated | 0.16 | -0.55 | 30.75 | -9.72 | 2.3783 | -0.0643 | |||
| DHR / Danaher Corporation | 0.13 | -2.17 | 30.29 | -19.22 | 2.3422 | -0.3463 | |||
| DASH / DoorDash, Inc. | 0.18 | -1.62 | 30.27 | 15.62 | 2.3414 | 0.4638 | |||
| ORLY / O'Reilly Automotive, Inc. | 0.03 | -1.63 | 29.77 | 1.29 | 2.3025 | 0.1949 | |||
| FIX / Comfort Systems USA, Inc. | 0.07 | 3.25 | 27.57 | 12.16 | 2.1322 | 0.3696 | |||
| INTU / Intuit Inc. | 0.04 | -12.72 | 27.00 | -11.66 | 2.0880 | -0.1035 | |||
| CTVA / Corteva, Inc. | 0.47 | -1.65 | 26.65 | -4.71 | 2.0610 | 0.0556 | |||
| ETN / Eaton Corporation plc | 0.08 | 9.66 | 26.40 | 9.80 | 2.0415 | 0.3176 | |||
| BDX / Becton, Dickinson and Company | 0.08 | -1.64 | 17.62 | -7.44 | 1.3625 | -0.0024 | |||
| ON / ON Semiconductor Corporation | 0.28 | -46.33 | 17.39 | -53.40 | 1.3453 | -1.3312 | |||
| SHW / The Sherwin-Williams Company | 0.05 | -18.58 | 16.50 | -27.48 | 1.2764 | -0.3556 | |||
| BLD / TopBuild Corp. | 0.05 | 6.61 | 16.26 | -18.41 | 1.2575 | -0.1715 | |||
| KOS / Kosmos Energy Ltd. | 4.01 | 0.00 | 13.71 | -15.14 | 1.0602 | -0.0981 | |||
| AGNC / AGNC Investment Corp. | 1.35 | -1.67 | 12.45 | -13.43 | 0.9629 | -0.0683 | |||
| BRK.A / Berkshire Hathaway Inc. | 0.02 | -68.99 | 9.14 | -69.46 | 0.7065 | -1.4382 | |||
| COKE / Coca-Cola Consolidated, Inc. | 0.01 | -12.09 | 8.89 | -15.86 | 0.6872 | -0.0701 | |||
| TSM / Taiwan Semiconductor Manufacturing Company Limited - Depositary Receipt (Common Stock) | 0.04 | -12.55 | 8.02 | -0.56 | 0.6206 | 0.0420 | |||
| HPE / Hewlett Packard Enterprise Company | 0.35 | -1.44 | 7.44 | 2.85 | 0.5752 | 0.0566 | |||
| MA / Mastercard Incorporated | 0.01 | -5.11 | 7.18 | 1.18 | 0.5549 | 0.0464 | |||
| TMO / Thermo Fisher Scientific Inc. | 0.01 | -4.91 | 5.85 | -20.03 | 0.4526 | -0.0721 | |||
| ECL / Ecolab Inc. | 0.02 | -4.88 | 5.64 | -12.71 | 0.4363 | -0.0271 | |||
| ROP / Roper Technologies, Inc. | 0.01 | -5.02 | 5.57 | -11.27 | 0.4306 | -0.0193 | |||
| ISRG / Intuitive Surgical, Inc. | 0.01 | -5.41 | 5.31 | 0.49 | 0.4104 | 0.0318 | |||
| RTX / RTX Corporation | 0.04 | -3.39 | 4.88 | -7.73 | 0.3774 | -0.0018 | |||
| NEE.PRN / NextEra Energy Capital Holdings, Inc. - Corporate Bond/Note | 0.07 | -5.11 | 4.79 | -19.54 | 0.3705 | -0.0564 | |||
| PANW / Palo Alto Networks, Inc. | 0.02 | 87.07 | 4.46 | -0.40 | 0.3449 | 0.0238 | |||
| EBAY / eBay Inc. | 0.07 | -14.33 | 4.34 | -18.48 | 0.3353 | -0.0461 | |||
| AWK / American Water Works Company, Inc. | 0.03 | -4.99 | 3.81 | -19.12 | 0.2945 | -0.0431 | |||
| XYL / Xylem Inc. | 0.03 | -4.91 | 3.55 | -18.30 | 0.2748 | -0.0371 | |||
| WM / Waste Management, Inc. | 0.02 | -4.99 | 3.25 | -7.66 | 0.2517 | -0.0010 | |||
| V / Visa Inc. | 0.01 | -5.16 | 2.90 | 9.05 | 0.2246 | 0.0336 | |||
| ACN / Accenture plc | 0.01 | 34.01 | 2.88 | 33.40 | 0.2231 | 0.0680 | |||
| RCL / Royal Caribbean Cruises Ltd. | 0.01 | 0.35 | 2.68 | 30.51 | 0.2071 | 0.0600 | |||
| MRVL / Marvell Technology, Inc. | 0.02 | 28.23 | 2.57 | 96.41 | 0.1989 | 0.1050 | |||
| MELI / MercadoLibre, Inc. | 0.00 | 0.00 | 2.55 | -17.13 | 0.1973 | -0.0234 | |||
| CRM / Salesforce, Inc. | 0.01 | 41.62 | 2.44 | 73.05 | 0.1887 | 0.0876 | |||
| WTS / Watts Water Technologies, Inc. | 0.01 | -5.12 | 2.29 | -6.92 | 0.1768 | 0.0007 | |||
| SHOP / Shopify Inc. | 0.02 | -5.13 | 2.17 | 25.88 | 0.1682 | 0.0443 | |||
| EGP / EastGroup Properties, Inc. | 0.01 | 54.31 | 1.97 | 32.55 | 0.1522 | 0.0457 | |||
| BALL / Ball Corporation | 0.03 | -5.13 | 1.63 | -23.00 | 0.1259 | -0.0257 | |||
| CCL / Carnival Corporation & plc | 0.06 | 0.36 | 1.60 | 35.42 | 0.1239 | 0.0390 | |||
| CP / Canadian Pacific Kansas City Limited | 0.02 | -5.13 | 1.59 | -19.71 | 0.1226 | -0.0190 | |||
| CWK / Cushman & Wakefield plc | 0.12 | 24.69 | 1.54 | 19.63 | 0.1188 | 0.0268 | |||
| VMC / Vulcan Materials Company | 0.01 | 6.81 | 1.53 | 9.74 | 0.1186 | 0.0184 | |||
| AXON / Axon Enterprise, Inc. | 0.00 | -20.92 | 1.48 | 17.62 | 0.1147 | 0.0243 | |||
| VLTO / Veralto Corporation | 0.01 | -4.76 | 1.47 | -13.29 | 0.1136 | -0.0079 | |||
| EW / Edwards Lifesciences Corporation | 0.02 | -5.13 | 1.44 | 6.44 | 0.1112 | 0.0143 | |||
| FTI / TechnipFMC plc | 0.05 | 44.70 | 1.40 | 59.57 | 0.1084 | 0.0455 | |||
| APTV / Aptiv PLC | 0.02 | 1.38 | 0.1069 | 0.1069 | |||||
| TYL / Tyler Technologies, Inc. | 0.00 | 0.42 | 1.37 | -0.80 | 0.1060 | 0.0069 | |||
| TJX / The TJX Companies, Inc. | 0.01 | 1.31 | 0.1015 | 0.1015 | |||||
| NDAQ / Nasdaq, Inc. | 0.02 | -21.29 | 1.22 | -16.68 | 0.0943 | -0.0106 | |||
| FSLR / First Solar, Inc. | 0.01 | 1.20 | 0.0932 | 0.0932 | |||||
| XPO / XPO, Inc. | 0.01 | 130.74 | 1.19 | 181.71 | 0.0917 | 0.0615 | |||
| ZION / Zions Bancorporation, National Association | 0.02 | 0.33 | 1.15 | 15.29 | 0.0887 | 0.0173 | |||
| AGCO / AGCO Corporation | 0.01 | -5.14 | 1.14 | -9.39 | 0.0881 | -0.0020 | |||
| QCOM / QUALCOMM Incorporated | 0.01 | 0.00 | 1.14 | -9.70 | 0.0879 | -0.0023 | |||
| MSCI / MSCI Inc. | 0.00 | 5.94 | 1.12 | 9.03 | 0.0869 | 0.0130 | |||
| GRAB / Grab Holdings Limited | 0.23 | 1.10 | 0.0854 | 0.0854 | |||||
| PFGC / Performance Food Group Company | 0.01 | 0.35 | 1.10 | 8.25 | 0.0853 | 0.0122 | |||
| APO / Apollo Global Management, Inc. | 0.01 | 0.38 | 1.10 | 32.77 | 0.0849 | 0.0256 | |||
| WAL / Western Alliance Bancorporation | 0.01 | 6.54 | 1.05 | 2.95 | 0.0811 | 0.0080 | |||
| CMA / Comerica Incorporated | 0.02 | 0.33 | 1.03 | 3.63 | 0.0795 | 0.0083 | |||
| HRI / Herc Holdings Inc. | 0.01 | 0.38 | 1.00 | 19.29 | 0.0775 | 0.0172 | |||
| SKX / Skechers U.S.A., Inc. | 0.01 | 71.82 | 0.99 | 72.87 | 0.0769 | 0.0356 | |||
| DPZ / Domino's Pizza, Inc. | 0.00 | 0.99 | 0.0763 | 0.0763 | |||||
| TOL / Toll Brothers, Inc. | 0.01 | 17.77 | 0.88 | -4.05 | 0.0678 | 0.0023 | |||
| AZEK / The AZEK Company Inc. | 0.02 | 0.35 | 0.81 | 1.75 | 0.0629 | 0.0056 | |||
| GEV / GE Vernova Inc. | 0.00 | -38.02 | 0.81 | -20.08 | 0.0628 | -0.0100 | |||
| ARES / Ares Management Corporation | 0.00 | 0.34 | 0.79 | 13.94 | 0.0614 | 0.0115 | |||
| MSI / Motorola Solutions, Inc. | 0.00 | -3.25 | 0.79 | -0.51 | 0.0607 | 0.0041 | |||
| CCEP / Coca-Cola Europacific Partners PLC | 0.01 | 0.00 | 0.76 | -2.55 | 0.0591 | 0.0029 | |||
| HLIO / Helios Technologies, Inc. | 0.02 | 0.76 | 0.0589 | 0.0589 | |||||
| FLS / Flowserve Corporation | 0.01 | 69.32 | 0.75 | 88.25 | 0.0583 | 0.0296 | |||
| ASML / ASML Holding N.V. - Depositary Receipt (Common Stock) | 0.00 | 0.00 | 0.71 | -16.90 | 0.0552 | -0.0063 | |||
| HUBB / Hubbell Incorporated | 0.00 | 0.30 | 0.70 | -1.97 | 0.0539 | 0.0030 | |||
| AVTR / Avantor, Inc. | 0.03 | -3.45 | 0.65 | -21.38 | 0.0504 | -0.0090 | |||
| A / Agilent Technologies, Inc. | 0.00 | 11.02 | 0.65 | 0.46 | 0.0502 | 0.0039 | |||
| KMPR / Kemper Corporation | 0.01 | 0.31 | 0.65 | 8.74 | 0.0501 | 0.0074 | |||
| TFII / TFI International Inc. | 0.00 | -26.21 | 0.62 | -27.12 | 0.0478 | -0.0131 | |||
| HIG / The Hartford Insurance Group, Inc. | 0.01 | 0.37 | 0.60 | -6.54 | 0.0464 | 0.0003 | |||
| CACI / CACI International Inc | 0.00 | 0.34 | 0.60 | -19.57 | 0.0464 | -0.0071 | |||
| WMS / Advanced Drainage Systems, Inc. | 0.01 | 12.99 | 0.59 | -16.90 | 0.0456 | -0.0053 | |||
| DKS / DICK'S Sporting Goods, Inc. | 0.00 | 0.57 | 0.0437 | 0.0437 | |||||
| OWL / Blue Owl Capital Inc. | 0.02 | 0.56 | 0.0433 | 0.0433 | |||||
| BRKR / Bruker Corporation | 0.01 | -15.85 | 0.55 | -28.53 | 0.0423 | -0.0126 | |||
| CDW / CDW Corporation | 0.00 | -29.15 | 0.53 | -45.59 | 0.0411 | -0.0288 | |||
| AZO / AutoZone, Inc. | 0.00 | -31.76 | 0.51 | -30.56 | 0.0394 | -0.0133 | |||
| MDB / MongoDB, Inc. | 0.00 | 460.78 | 0.50 | 382.69 | 0.0389 | 0.0314 | |||
| AME / AMETEK, Inc. | 0.00 | 0.18 | 0.50 | 5.10 | 0.0383 | 0.0045 | |||
| DHI / D.R. Horton, Inc. | 0.00 | 61.54 | 0.48 | 18.34 | 0.0375 | 0.0081 | |||
| AAON / AAON, Inc. | 0.00 | -60.28 | 0.48 | -56.71 | 0.0373 | -0.0425 | |||
| CR / Crane Company | 0.00 | 39.38 | 0.48 | 33.89 | 0.0370 | 0.0113 | |||
| RGA / Reinsurance Group of America, Incorporated | 0.00 | 0.45 | 0.48 | -1.45 | 0.0368 | 0.0022 | |||
| LECO / Lincoln Electric Holdings, Inc. | 0.00 | 0.48 | 0.0368 | 0.0368 | |||||
| BBY / Best Buy Co., Inc. | 0.01 | -36.11 | 0.47 | -47.01 | 0.0363 | -0.0272 | |||
| EXR / Extra Space Storage Inc. | 0.00 | -56.74 | 0.45 | -64.06 | 0.0349 | -0.0552 | |||
| BLDR / Builders FirstSource, Inc. | 0.00 | -42.69 | 0.45 | -57.74 | 0.0344 | -0.0411 | |||
| AER / AerCap Holdings N.V. | 0.00 | 0.00 | 0.44 | 0.93 | 0.0338 | 0.0028 | |||
| ALLE / Allegion plc | 0.00 | -49.15 | 0.43 | -54.49 | 0.0334 | -0.0345 | |||
| AUB / Atlantic Union Bankshares Corporation | 0.01 | 0.40 | 0.43 | 0.95 | 0.0330 | 0.0027 | |||
| ALL / The Allstate Corporation | 0.00 | 0.24 | 0.41 | 1.75 | 0.0315 | 0.0028 | |||
| NVT / nVent Electric plc | 0.01 | -66.21 | 0.40 | -67.27 | 0.0308 | -0.0564 | |||
| ENPH / Enphase Energy, Inc. | 0.01 | -5.15 | 0.39 | -42.44 | 0.0304 | -0.0185 | |||
| SNPS / Synopsys, Inc. | 0.00 | 0.00 | 0.33 | -4.12 | 0.0253 | 0.0008 | |||
| VRT / Vertiv Holdings Co | 0.00 | -11.97 | 0.33 | 0.31 | 0.0252 | 0.0020 | |||
| CDNS / Cadence Design Systems, Inc. | 0.00 | 9.29 | 0.32 | 21.37 | 0.0246 | 0.0058 | |||
| CLS / Celestica Inc. | 0.00 | 0.32 | 0.0245 | 0.0245 | |||||
| HOLX / Hologic, Inc. | 0.00 | 0.00 | 0.30 | -11.47 | 0.0233 | -0.0011 | |||
| CLH / Clean Harbors, Inc. | 0.00 | 0.00 | 0.29 | -4.90 | 0.0226 | 0.0006 | |||
| EQIX / Equinix, Inc. | 0.00 | 0.00 | 0.28 | 5.99 | 0.0219 | 0.0028 | |||
| PLNT / Planet Fitness, Inc. | 0.00 | 0.00 | 0.26 | 21.76 | 0.0204 | 0.0049 | |||
| BSX / Boston Scientific Corporation | 0.00 | 0.00 | 0.24 | 6.73 | 0.0184 | 0.0024 | |||
| SITE / SiteOne Landscape Supply, Inc. | 0.00 | 1.44 | 0.23 | -11.49 | 0.0179 | -0.0008 | |||
| DXCM / DexCom, Inc. | 0.00 | 13.91 | 0.22 | 32.54 | 0.0173 | 0.0052 | |||
| ANSS / ANSYS, Inc. | 0.00 | -17.42 | 0.21 | -12.55 | 0.0162 | -0.0010 | |||
| NTRA / Natera, Inc. | 0.00 | -25.29 | 0.21 | -6.82 | 0.0159 | 0.0001 | |||
| SNOW / Snowflake Inc. | 0.00 | -19.40 | 0.20 | 8.33 | 0.0151 | 0.0022 | |||
| SPGI / S&P Global Inc. | 0.00 | 0.00 | 0.19 | -3.63 | 0.0144 | 0.0006 | |||
| CNM / Core & Main, Inc. | 0.00 | 0.00 | 0.19 | 14.81 | 0.0144 | 0.0028 | |||
| CYBR / CyberArk Software Ltd. | 0.00 | 0.00 | 0.18 | 14.38 | 0.0136 | 0.0026 | |||
| IEX / IDEX Corporation | 0.00 | 18.14 | 0.17 | 15.33 | 0.0134 | 0.0026 | |||
| HUBS / HubSpot, Inc. | 0.00 | -13.38 | 0.17 | 14.00 | 0.0133 | 0.0024 | |||
| ALTR / Altair Engineering Inc. | 0.00 | 0.00 | 0.17 | 14.09 | 0.0132 | 0.0025 | |||
| MRK / Merck & Co., Inc. | 0.00 | 0.00 | 0.17 | -12.37 | 0.0132 | -0.0008 | |||
| OSIS / OSI Systems, Inc. | 0.00 | 1.00 | 0.17 | 11.26 | 0.0131 | 0.0022 | |||
| WCN / Waste Connections, Inc. | 0.00 | 0.00 | 0.17 | -4.00 | 0.0131 | 0.0004 | |||
| WAB / Westinghouse Air Brake Technologies Corporation | 0.00 | 0.00 | 0.17 | 3.77 | 0.0128 | 0.0014 | |||
| TMUS / T-Mobile US, Inc. | 0.00 | -18.12 | 0.16 | -12.37 | 0.0126 | -0.0007 | |||
| CSGP / CoStar Group, Inc. | 0.00 | 0.00 | 0.16 | -4.76 | 0.0124 | 0.0003 | |||
| DLR / Digital Realty Trust, Inc. | 0.00 | -14.31 | 0.16 | -5.88 | 0.0124 | 0.0002 | |||
| PTC / PTC Inc. | 0.00 | 0.00 | 0.16 | 1.28 | 0.0123 | 0.0011 | |||
| ADBE / Adobe Inc. | 0.00 | -91.50 | 0.16 | -92.71 | 0.0122 | -0.1432 | |||
| COST / Costco Wholesale Corporation | 0.00 | 0.00 | 0.16 | 3.33 | 0.0120 | 0.0012 | |||
| BJ / BJ's Wholesale Club Holdings, Inc. | 0.00 | 0.00 | 0.15 | 8.51 | 0.0119 | 0.0017 | |||
| APG / APi Group Corporation | 0.00 | 0.00 | 0.15 | 9.35 | 0.0118 | 0.0018 | |||
| ESTC / Elastic N.V. | 0.00 | 26.38 | 0.15 | 63.44 | 0.0118 | 0.0051 | |||
| GDDY / GoDaddy Inc. | 0.00 | -32.74 | 0.15 | -15.34 | 0.0115 | -0.0011 | |||
| SFM / Sprouts Farmers Market, Inc. | 0.00 | -13.90 | 0.15 | -1.33 | 0.0115 | 0.0007 | |||
| ADSK / Autodesk, Inc. | 0.00 | 27.11 | 0.15 | 36.45 | 0.0114 | 0.0036 | |||
| ROL / Rollins, Inc. | 0.00 | 0.00 | 0.15 | -8.81 | 0.0113 | -0.0001 | |||
| CRWD / CrowdStrike Holdings, Inc. | 0.00 | 0.00 | 0.14 | 22.03 | 0.0112 | 0.0027 | |||
| ZS / Zscaler, Inc. | 0.00 | 20.94 | 0.14 | 27.68 | 0.0111 | 0.0030 | |||
| DSGX / The Descartes Systems Group Inc. | 0.00 | -15.82 | 0.14 | -7.14 | 0.0111 | 0.0000 | |||
| LH / Labcorp Holdings Inc. | 0.00 | 0.00 | 0.14 | 2.26 | 0.0106 | 0.0010 | |||
| MDT / Medtronic plc | 0.00 | 0.00 | 0.13 | -11.26 | 0.0104 | -0.0005 | |||
| MSA / MSA Safety Incorporated | 0.00 | 0.00 | 0.13 | -6.99 | 0.0104 | 0.0001 | |||
| EXAS / Exact Sciences Corporation | 0.00 | 28.41 | 0.13 | 5.56 | 0.0104 | 0.0013 | |||
| HQY / HealthEquity, Inc. | 0.00 | 0.00 | 0.13 | 17.59 | 0.0098 | 0.0021 | |||
| AMD / Advanced Micro Devices, Inc. | 0.00 | 0.00 | 0.13 | -26.16 | 0.0098 | -0.0026 | |||
| VRNS / Varonis Systems, Inc. | 0.00 | 0.00 | 0.13 | -21.25 | 0.0098 | -0.0017 | |||
| FOUR / Shift4 Payments, Inc. | 0.00 | -25.08 | 0.13 | -11.89 | 0.0098 | -0.0006 | |||
| WTRG / Essential Utilities, Inc. | 0.00 | 0.00 | 0.12 | -6.11 | 0.0096 | 0.0001 | |||
| PNR / Pentair plc | 0.00 | -17.04 | 0.12 | -15.28 | 0.0095 | -0.0008 | |||
| UNH / UnitedHealth Group Incorporated | 0.00 | 0.00 | 0.12 | -13.77 | 0.0093 | -0.0007 | |||
| NYT / The New York Times Company | 0.00 | 0.00 | 0.12 | -6.35 | 0.0092 | 0.0001 | |||
| ORCL / Oracle Corporation | 0.00 | 0.00 | 0.12 | -1.67 | 0.0092 | 0.0005 | |||
| STE / STERIS plc | 0.00 | 0.00 | 0.12 | -15.33 | 0.0090 | -0.0008 | |||
| TSCO / Tractor Supply Company | 0.00 | 400.00 | 0.12 | -8.66 | 0.0090 | -0.0002 | |||
| SPSC / SPS Commerce, Inc. | 0.00 | 55.67 | 0.12 | 48.72 | 0.0090 | 0.0033 | |||
| ACM / AECOM | 0.00 | 0.00 | 0.12 | 2.68 | 0.0090 | 0.0009 | |||
| VZ / Verizon Communications Inc. | 0.00 | 0.00 | 0.12 | -10.85 | 0.0089 | -0.0004 | |||
| S / SentinelOne, Inc. | 0.01 | 0.00 | 0.11 | -7.38 | 0.0088 | 0.0000 | |||
| AOS / A. O. Smith Corporation | 0.00 | 0.00 | 0.11 | -24.31 | 0.0085 | -0.0019 | |||
| NFLX / Netflix, Inc. | 0.00 | -21.79 | 0.11 | -1.82 | 0.0084 | 0.0005 | |||
| TEAM / Atlassian Corporation | 0.00 | -24.23 | 0.11 | 16.13 | 0.0084 | 0.0017 | |||
| MANH / Manhattan Associates, Inc. | 0.00 | 0.00 | 0.11 | -3.60 | 0.0083 | 0.0003 | |||
| TRU / TransUnion | 0.00 | 0.00 | 0.10 | -11.21 | 0.0080 | -0.0004 | |||
| AIT / Applied Industrial Technologies, Inc. | 0.00 | 0.00 | 0.10 | 7.37 | 0.0080 | 0.0011 | |||
| JBT / JBT Marel Corporation | 0.00 | 0.00 | 0.10 | 29.49 | 0.0079 | 0.0022 | |||
| RPD / Rapid7, Inc. | 0.00 | 45.25 | 0.10 | 45.59 | 0.0077 | 0.0028 | |||
| TTC / The Toro Company | 0.00 | 0.00 | 0.10 | -7.55 | 0.0076 | -0.0000 | |||
| ZWS / Zurn Elkay Water Solutions Corporation | 0.00 | 0.00 | 0.10 | 3.19 | 0.0076 | 0.0008 | |||
| GNTX / Gentex Corporation | 0.00 | 0.00 | 0.10 | -3.00 | 0.0075 | 0.0003 | |||
| TER / Teradyne, Inc. | 0.00 | 0.00 | 0.10 | -5.83 | 0.0075 | 0.0001 | |||
| FTXP / Foothills Exploration, Inc. | 0.00 | 0.00 | 0.10 | -18.80 | 0.0074 | -0.0010 | |||
| WIX / Wix.com Ltd. | 0.00 | -21.90 | 0.09 | 0.00 | 0.0072 | 0.0005 | |||
| BSY / Bentley Systems, Incorporated | 0.00 | 0.00 | 0.09 | -8.91 | 0.0072 | -0.0001 | |||
| FDS / FactSet Research Systems Inc. | 0.00 | 0.00 | 0.09 | 4.55 | 0.0071 | 0.0008 | |||
| GPN / Global Payments Inc. | 0.00 | 0.00 | 0.09 | 9.76 | 0.0070 | 0.0011 | |||
| LFUS / Littelfuse, Inc. | 0.00 | 0.00 | 0.09 | -11.76 | 0.0070 | -0.0003 | |||
| IT / Gartner, Inc. | 0.00 | 0.00 | 0.09 | -4.26 | 0.0070 | 0.0002 | |||
| ALRM / Alarm.com Holdings, Inc. | 0.00 | 0.00 | 0.09 | 11.25 | 0.0069 | 0.0011 | |||
| EXPO / Exponent, Inc. | 0.00 | 0.00 | 0.09 | -22.52 | 0.0067 | -0.0013 | |||
| LULU / lululemon athletica inc. | 0.00 | 0.00 | 0.08 | 41.38 | 0.0064 | 0.0022 | |||
| TTEK / Tetra Tech, Inc. | 0.00 | -21.43 | 0.08 | -33.61 | 0.0063 | -0.0025 | |||
| MAS / Masco Corporation | 0.00 | 0.00 | 0.08 | -13.98 | 0.0062 | -0.0005 | |||
| FI / Fiserv, Inc. | 0.00 | -53.12 | 0.08 | -46.31 | 0.0062 | -0.0045 | |||
| SYM / Symbotic Inc. | 0.00 | -26.81 | 0.08 | -28.83 | 0.0061 | -0.0019 | |||
| CMG / Chipotle Mexican Grill, Inc. | 0.00 | 0.00 | 0.08 | 5.41 | 0.0061 | 0.0007 | |||
| MSEX / Middlesex Water Company | 0.00 | 0.00 | 0.07 | -19.32 | 0.0055 | -0.0008 | |||
| CTAS / Cintas Corporation | 0.00 | -29.35 | 0.07 | -37.17 | 0.0055 | -0.0026 | |||
| GRMN / Garmin Ltd. | 0.00 | -39.27 | 0.07 | -29.17 | 0.0053 | -0.0016 | |||
| MTD / Mettler-Toledo International Inc. | 0.00 | 0.00 | 0.07 | -18.29 | 0.0052 | -0.0007 | |||
| CYRX / Cryoport, Inc. | 0.01 | 0.00 | 0.07 | -4.35 | 0.0052 | 0.0002 | |||
| CWT / California Water Service Group | 0.00 | 0.00 | 0.07 | -16.46 | 0.0051 | -0.0006 | |||
| SHCO / Soho House & Co Inc. | 0.01 | 0.00 | 0.07 | 46.67 | 0.0051 | 0.0019 | |||
| CVS / CVS Health Corporation | 0.00 | 0.00 | 0.07 | -28.57 | 0.0051 | -0.0015 | |||
| YETI / YETI Holdings, Inc. | 0.00 | 0.00 | 0.07 | -5.80 | 0.0051 | 0.0001 | |||
| OKTA / Okta, Inc. | 0.00 | 0.00 | 0.06 | 6.78 | 0.0049 | 0.0006 | |||
| ROK / Rockwell Automation, Inc. | 0.00 | -38.61 | 0.05 | -34.57 | 0.0041 | -0.0017 | |||
| PGNY / Progyny, Inc. | 0.00 | 0.00 | 0.05 | 1.96 | 0.0041 | 0.0004 | |||
| GNRC / Generac Holdings Inc. | 0.00 | 0.05 | 0.0038 | 0.0038 | |||||
| IDXX / IDEXX Laboratories, Inc. | 0.00 | 0.00 | 0.05 | -18.64 | 0.0038 | -0.0005 | |||
| SJW / SJW Group | 0.00 | 0.00 | 0.05 | -16.67 | 0.0035 | -0.0003 | |||
| COR / Cencora, Inc. | 0.00 | -100.00 | 0.00 | -100.00 | -0.0709 | ||||
| APTV / Aptiv PLC | 0.00 | -100.00 | 0.00 | 0.0000 | |||||
| FYBR / Frontier Communications Parent, Inc. | 0.00 | -100.00 | 0.00 | 0.0000 | |||||
| IQV / IQVIA Holdings Inc. | 0.00 | -100.00 | 0.00 | 0.0000 | |||||
| AVY / Avery Dennison Corporation | 0.00 | -100.00 | 0.00 | 0.0000 | |||||
| ONTO / Onto Innovation Inc. | 0.00 | -100.00 | 0.00 | -100.00 | -0.0402 | ||||
| EFX / Equifax Inc. | 0.00 | -100.00 | 0.00 | -100.00 | -0.0255 | ||||
| KNSL / Kinsale Capital Group, Inc. | 0.00 | -100.00 | 0.00 | -100.00 | -1.3449 | ||||
| PRMW / Primo Water Corporation | 0.00 | -100.00 | 0.00 | 0.0000 | |||||
| CSTM / Constellium SE | 0.00 | -100.00 | 0.00 | -100.00 | -0.0330 |