Basic Stats
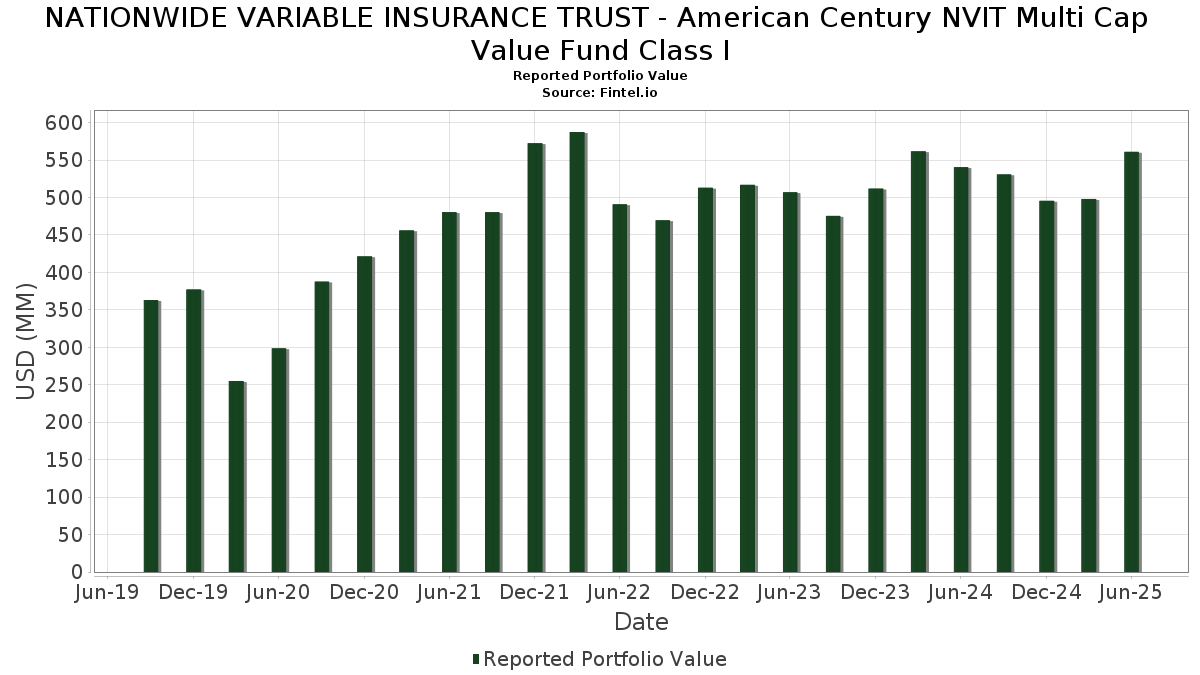
| Portfolio Value | $ 561,015,724 |
| Current Positions | 78 |
Latest Holdings, Performance, AUM (from 13F, 13D)
NATIONWIDE VARIABLE INSURANCE TRUST - American Century NVIT Multi Cap Value Fund Class I has disclosed 78 total holdings in their latest SEC filings. Most recent portfolio value is calculated to be $ 561,015,724 USD. Actual Assets Under Management (AUM) is this value plus cash (which is not disclosed). NATIONWIDE VARIABLE INSURANCE TRUST - American Century NVIT Multi Cap Value Fund Class I’s top holdings are JPMorgan Chase & Co. (US:JPM) , Cisco Systems, Inc. (US:CSCO) , Berkshire Hathaway Inc. (US:BRK.B) , AT&T Inc. (US:T) , and Johnson & Johnson (US:JNJ) . NATIONWIDE VARIABLE INSURANCE TRUST - American Century NVIT Multi Cap Value Fund Class I’s new positions include Carlisle Companies Incorporated (US:CSL) , Permian Resources Corporation (US:PR) , Honeywell International Inc. (US:HON) , .
Top Increases This Quarter
We use the change in the portfolio allocation because this is the most meaningful metric. Changes can be due to trades or changes in share prices.
| Security | Shares (MM) |
Value (MM$) |
Portfolio % | ΔPortfolio % |
|---|---|---|---|---|
| 15.00 | 2.7568 | 2.7568 | ||
| 12.00 | 2.2055 | 2.2055 | ||
| 6.42 | 1.1802 | 1.1802 | ||
| 5.00 | 0.9189 | 0.9189 | ||
| 0.01 | 4.80 | 0.8826 | 0.8826 | |
| 0.32 | 4.35 | 0.7998 | 0.7998 | |
| 0.08 | 23.13 | 4.2519 | 0.7735 | |
| 0.04 | 6.51 | 1.1963 | 0.7569 | |
| 4.00 | 0.7352 | 0.7352 | ||
| 0.01 | 9.83 | 1.8074 | 0.7347 |
Top Decreases This Quarter
We use the change in the portfolio allocation because this is the most meaningful metric. Changes can be due to trades or changes in share prices.
| Security | Shares (MM) |
Value (MM$) |
Portfolio % | ΔPortfolio % |
|---|---|---|---|---|
| 0.08 | 3.49 | 0.6412 | -1.4386 | |
| 0.03 | 8.56 | 1.5725 | -1.1770 | |
| 0.07 | 3.97 | 0.7303 | -0.8501 | |
| 0.02 | 2.60 | 0.4778 | -0.6524 | |
| 0.04 | 17.85 | 3.2810 | -0.6320 | |
| 0.02 | 3.24 | 0.5953 | -0.6072 | |
| 0.10 | 2.12 | 0.3890 | -0.5239 | |
| 0.08 | 4.73 | 0.8689 | -0.5142 | |
| 0.01 | 3.25 | 0.5967 | -0.4530 | |
| 0.09 | 6.52 | 1.1975 | -0.3428 |
13F and Fund Filings
This form was filed on 2025-08-20 for the reporting period 2025-06-30. Click the link icon to see the full transaction history.
Upgrade to unlock premium data and export to Excel ![]() .
.
| Security | Type | Avg Share Price | Shares (MM) |
ΔShares (%) |
ΔShares (%) |
Value ($MM) |
Portfolio (%) |
ΔPortfolio (%) |
|
|---|---|---|---|---|---|---|---|---|---|
| JPM / JPMorgan Chase & Co. | 0.08 | 5.59 | 23.13 | 24.79 | 4.2519 | 0.7735 | |||
| U.S. Treasury Bills / STIV (US912797MG92) | 21.90 | 1.06 | 4.0257 | -0.0409 | |||||
| CSCO / Cisco Systems, Inc. | 0.29 | 4.61 | 20.03 | 17.61 | 3.6808 | 0.4858 | |||
| BRK.B / Berkshire Hathaway Inc. | 0.04 | -6.15 | 17.85 | -14.40 | 3.2810 | -0.6320 | |||
| T / AT&T Inc. | 0.57 | -9.53 | 16.61 | -7.42 | 3.0529 | -0.3133 | |||
| JNJ / Johnson & Johnson | 0.11 | 41.11 | 16.38 | 29.97 | 3.0109 | 0.6459 | |||
| LHX / L3Harris Technologies, Inc. | 0.06 | 1.36 | 15.28 | 21.48 | 2.8087 | 0.4483 | |||
| Government Agency Repurchase Agreement / RA (N/A) | 15.00 | 2.7568 | 2.7568 | ||||||
| BAC / Bank of America Corporation | 0.31 | -17.07 | 14.79 | -5.96 | 2.7184 | -0.2327 | |||
| MDT / Medtronic plc | 0.15 | 3.92 | 13.46 | 0.82 | 2.4731 | -0.0313 | |||
| AIZ / Assurant, Inc. | 0.07 | -1.98 | 12.91 | -7.71 | 2.3723 | -0.2518 | |||
| BA.C / Bank of America Corporation - Depositary Receipt (Common Stock) | 12.00 | 2.2055 | 2.2055 | ||||||
| HUBB / Hubbell Incorporated | 0.03 | 2.59 | 10.94 | 26.62 | 2.0108 | 0.3896 | |||
| COF / Capital One Financial Corporation | 0.05 | 23.89 | 10.93 | 47.02 | 2.0079 | 0.6136 | |||
| RCL / Royal Caribbean Cruises Ltd. | 0.03 | 1.17 | 10.85 | 54.22 | 1.9933 | 0.6738 | |||
| AON / Aon plc | 0.03 | 2.70 | 10.20 | -8.19 | 1.8743 | -0.2099 | |||
| XOM / Exxon Mobil Corporation | 0.09 | 2.72 | 10.19 | -6.90 | 1.8730 | -0.1807 | |||
| IP / International Paper Company | 0.22 | 26.87 | 10.12 | 11.37 | 1.8591 | 0.1549 | |||
| CRH / CRH plc | 0.11 | 28.00 | 10.08 | 33.56 | 1.8529 | 0.4367 | |||
| GS / The Goldman Sachs Group, Inc. | 0.01 | 32.76 | 9.83 | 72.01 | 1.8074 | 0.7347 | |||
| AIG / American International Group, Inc. | 0.11 | 15.25 | 9.75 | 13.46 | 1.7912 | 0.1796 | |||
| CSX / CSX Corporation | 0.30 | 9.40 | 9.74 | 21.29 | 1.7904 | 0.2836 | |||
| DHR / Danaher Corporation | 0.04 | -1.96 | 8.59 | -5.53 | 1.5786 | -0.1273 | |||
| UNH / UnitedHealth Group Incorporated | 0.03 | -1.98 | 8.56 | -41.61 | 1.5725 | -1.1770 | |||
| PSX / Phillips 66 | 0.07 | 23.92 | 8.39 | 19.73 | 1.5418 | 0.2272 | |||
| MPC / Marathon Petroleum Corporation | 0.05 | 30.52 | 8.35 | 48.82 | 1.5350 | 0.4820 | |||
| DIS / The Walt Disney Company | 0.06 | -1.96 | 7.80 | 23.18 | 1.4337 | 0.2455 | |||
| LVS / Las Vegas Sands Corp. | 0.17 | -17.41 | 7.60 | -6.98 | 1.3972 | -0.1362 | |||
| FHN / First Horizon Corporation | 0.36 | -1.96 | 7.59 | 7.02 | 1.3947 | 0.0643 | |||
| PM / Philip Morris International Inc. | 0.04 | -16.47 | 7.28 | -4.16 | 1.3382 | -0.0872 | |||
| ALC / Alcon Inc. | 0.08 | 4.64 | 7.01 | -2.69 | 1.2881 | -0.0632 | |||
| DLB / Dolby Laboratories, Inc. | 0.09 | -14.17 | 6.52 | -20.64 | 1.1975 | -0.3428 | |||
| TE Connectivity plc / EC (IE000IVNQZ81) | 0.04 | 132.87 | 6.51 | 178.04 | 1.1963 | 0.7569 | |||
| Government Agency Repurchase Agreement / RA (N/A) | 6.42 | 1.1802 | 1.1802 | ||||||
| FCX / Freeport-McMoRan Inc. | 0.15 | -1.98 | 6.42 | 12.23 | 1.1793 | 0.1066 | |||
| SCHW / The Charles Schwab Corporation | 0.07 | 57.93 | 6.25 | 162.45 | 1.1486 | 0.6888 | |||
| AMAT / Applied Materials, Inc. | 0.03 | 41.37 | 6.12 | 78.34 | 1.1244 | 0.4808 | |||
| LH / Labcorp Holdings Inc. | 0.02 | -1.94 | 5.87 | 10.61 | 1.0786 | 0.0831 | |||
| AME / AMETEK, Inc. | 0.03 | 6.90 | 5.84 | 12.38 | 1.0725 | 0.0982 | |||
| IBM / International Business Machines Corporation | 0.02 | -1.98 | 5.72 | 16.20 | 1.0522 | 0.1278 | |||
| FERG / Ferguson Enterprises Inc. | 0.03 | 55.71 | 5.68 | 111.66 | 1.0442 | 0.5404 | |||
| ICE / Intercontinental Exchange, Inc. | 0.03 | -26.34 | 5.39 | -21.67 | 0.9915 | -0.3005 | |||
| EQT / EQT Corporation | 0.09 | -25.27 | 5.15 | -18.43 | 0.9460 | -0.2380 | |||
| WY / Weyerhaeuser Company | 0.20 | 64.38 | 5.14 | 44.22 | 0.9453 | 0.2762 | |||
| BNP / BNP Paribas SA | 5.00 | 0.9189 | 0.9189 | ||||||
| CCK / Crown Holdings, Inc. | 0.05 | -11.23 | 5.00 | 2.42 | 0.9185 | 0.0029 | |||
| MET / MetLife, Inc. | 0.06 | -15.19 | 4.90 | -15.06 | 0.8998 | -0.1815 | |||
| CSL / Carlisle Companies Incorporated | 0.01 | 4.80 | 0.8826 | 0.8826 | |||||
| D / Dominion Energy, Inc. | 0.08 | -36.38 | 4.73 | -35.87 | 0.8689 | -0.5142 | |||
| JCI / Johnson Controls International plc | 0.04 | -25.85 | 4.55 | -2.24 | 0.8361 | -0.0369 | |||
| BAX / Baxter International Inc. | 0.15 | -12.82 | 4.44 | -22.88 | 0.8161 | -0.2642 | |||
| VOYA / Voya Financial, Inc. | 0.06 | 20.48 | 4.38 | 26.24 | 0.8048 | 0.1540 | |||
| PR / Permian Resources Corporation | 0.32 | 4.35 | 0.7998 | 0.7998 | |||||
| FANG / Diamondback Energy, Inc. | 0.03 | 26.44 | 4.20 | 8.66 | 0.7724 | 0.0467 | |||
| Government Agency Repurchase Agreement / RA (N/A) | 4.00 | 0.7352 | 0.7352 | ||||||
| NEM / Newmont Corporation | 0.07 | -60.91 | 3.97 | -52.83 | 0.7303 | -0.8501 | |||
| CEG / Constellation Energy Corporation | 0.01 | 21.86 | 3.91 | 95.11 | 0.7190 | 0.3427 | |||
| HWM / Howmet Aerospace Inc. | 0.02 | -46.32 | 3.87 | -22.99 | 0.7118 | -0.2317 | |||
| DAL / Delta Air Lines, Inc. | 0.08 | -1.51 | 3.81 | 11.09 | 0.6996 | 0.0568 | |||
| HON / Honeywell International Inc. | 0.02 | 3.75 | 0.6891 | 0.6891 | |||||
| RNR / RenaissanceRe Holdings Ltd. | 0.02 | -2.04 | 3.65 | -0.84 | 0.6711 | -0.0199 | |||
| BMY / Bristol-Myers Squibb Company | 0.08 | -58.53 | 3.49 | -68.53 | 0.6412 | -1.4386 | |||
| CME / CME Group Inc. | 0.01 | -44.15 | 3.25 | -41.97 | 0.5967 | -0.4530 | |||
| MS / Morgan Stanley | 0.02 | -66.45 | 3.24 | -49.33 | 0.5953 | -0.6072 | |||
| OMC / Omnicom Group Inc. | 0.04 | -15.41 | 3.09 | -26.62 | 0.5677 | -0.2219 | |||
| USB / U.S. Bancorp | 0.06 | 19.58 | 2.78 | 28.19 | 0.5116 | 0.1041 | |||
| GEV / GE Vernova Inc. | 0.01 | -32.08 | 2.67 | 17.72 | 0.4910 | 0.0652 | |||
| GILD / Gilead Sciences, Inc. | 0.02 | -56.39 | 2.60 | -56.85 | 0.4778 | -0.6524 | |||
| GM / General Motors Company | 0.05 | -1.97 | 2.55 | 2.57 | 0.4696 | 0.0022 | |||
| MMM / 3M Company | 0.02 | -31.24 | 2.53 | -28.72 | 0.4658 | -0.2014 | |||
| HES / Hess Corporation | 0.02 | -26.82 | 2.48 | -36.53 | 0.4557 | -0.2773 | |||
| S&P 500 E-Mini Index / DE (N/A) | 2.41 | 0.4437 | 0.4437 | ||||||
| U.S. Treasury Long Bond / DIR (N/A) | 2.20 | 0.4035 | 0.4035 | ||||||
| KVUE / Kenvue Inc. | 0.10 | -50.16 | 2.12 | -56.51 | 0.3890 | -0.5239 | |||
| Russell 1000 Value E-Mini Index / DE (N/A) | 1.13 | 0.2077 | 0.2077 | ||||||
| US592173AE84 / Metropolitan Life Insurance Co. | 1.00 | 0.1838 | 0.1838 | ||||||
| S&P 500 E-Mini Index / DE (N/A) | 0.93 | 0.1709 | 0.1709 | ||||||
| S&P 500 E-Mini Index / DE (N/A) | -0.93 | -0.1712 | -0.1712 |