Basic Stats
| Portfolio Value | $ 237,649,956 |
| Current Positions | 53 |
Latest Holdings, Performance, AUM (from 13F, 13D)
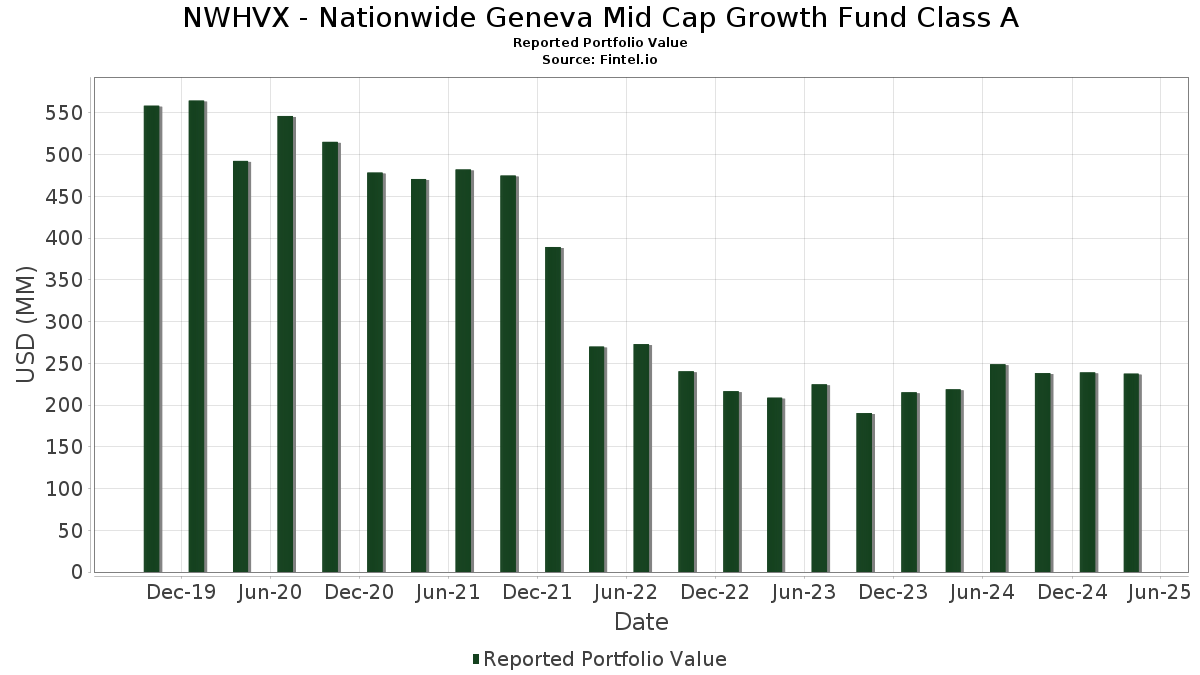
NWHVX - Nationwide Geneva Mid Cap Growth Fund Class A has disclosed 53 total holdings in their latest SEC filings. Most recent portfolio value is calculated to be $ 237,649,956 USD. Actual Assets Under Management (AUM) is this value plus cash (which is not disclosed). NWHVX - Nationwide Geneva Mid Cap Growth Fund Class A’s top holdings are Amphenol Corporation (US:APH) , Axon Enterprise, Inc. (US:AXON) , O'Reilly Automotive, Inc. (US:ORLY) , Copart, Inc. (US:CPRT) , and Rollins, Inc. (US:ROL) . NWHVX - Nationwide Geneva Mid Cap Growth Fund Class A’s new positions include Datadog, Inc. (US:DDOG) , .
Top Increases This Quarter
We use the change in the portfolio allocation because this is the most meaningful metric. Changes can be due to trades or changes in share prices.
| Security | Shares (MM) |
Value (MM$) |
Portfolio % | ΔPortfolio % |
|---|---|---|---|---|
| 8.63 | 3.7816 | 3.7816 | ||
| 0.02 | 2.03 | 0.8909 | 0.8909 | |
| 2.00 | 0.8768 | 0.8768 | ||
| 2.00 | 0.8768 | 0.8768 | ||
| 0.15 | 8.67 | 3.8013 | 0.7452 | |
| 0.15 | 11.46 | 5.0242 | 0.7361 | |
| 0.02 | 7.38 | 3.2372 | 0.6744 | |
| 0.17 | 10.08 | 4.4178 | 0.5269 | |
| 0.04 | 7.97 | 3.4927 | 0.4229 | |
| 0.03 | 8.39 | 3.6798 | 0.3688 |
Top Decreases This Quarter
We use the change in the portfolio allocation because this is the most meaningful metric. Changes can be due to trades or changes in share prices.
| Security | Shares (MM) |
Value (MM$) |
Portfolio % | ΔPortfolio % |
|---|---|---|---|---|
| 0.02 | 7.68 | 3.3659 | -0.6601 | |
| 0.02 | 1.39 | 0.6079 | -0.6189 | |
| 0.01 | 1.05 | 0.4594 | -0.6002 | |
| 0.02 | 2.47 | 1.0848 | -0.5443 | |
| 0.05 | 6.69 | 2.9315 | -0.4050 | |
| 0.03 | 4.52 | 1.9824 | -0.3893 | |
| 0.02 | 4.64 | 2.0358 | -0.3475 | |
| 0.04 | 8.21 | 3.5998 | -0.3099 | |
| 0.02 | 10.37 | 4.5456 | -0.3014 | |
| 0.03 | 2.75 | 1.2048 | -0.2353 |
13F and Fund Filings
This form was filed on 2025-06-18 for the reporting period 2025-04-30. Click the link icon to see the full transaction history.
Upgrade to unlock premium data and export to Excel ![]() .
.
| Security | Type | Avg Share Price | Shares (MM) |
ΔShares (%) |
ΔShares (%) |
Value ($MM) |
Portfolio (%) |
ΔPortfolio (%) |
|
|---|---|---|---|---|---|---|---|---|---|
| APH / Amphenol Corporation | 0.15 | 1.51 | 11.46 | 10.35 | 5.0242 | 0.7361 | |||
| AXON / Axon Enterprise, Inc. | 0.02 | -6.07 | 10.37 | -11.67 | 4.5456 | -0.3014 | |||
| ORLY / O'Reilly Automotive, Inc. | 0.01 | -13.63 | 10.26 | -5.57 | 4.4985 | 0.0118 | |||
| CPRT / Copart, Inc. | 0.17 | 1.51 | 10.08 | 6.94 | 4.4178 | 0.5269 | |||
| ROL / Rollins, Inc. | 0.15 | 1.51 | 8.67 | 17.16 | 3.8013 | 0.7452 | |||
| Treasury Repurchase Agreement / RA (N/A) | 8.63 | 3.7816 | 3.7816 | ||||||
| VRSK / Verisk Analytics, Inc. | 0.03 | 1.50 | 8.39 | 4.68 | 3.6798 | 0.3688 | |||
| FI / Fiserv, Inc. | 0.04 | 1.51 | 8.21 | -13.29 | 3.5998 | -0.3099 | |||
| HEIA / Heico Corp. - Class A | 0.04 | 1.51 | 7.97 | 7.16 | 3.4927 | 0.4229 | |||
| TYL / Tyler Technologies, Inc. | 0.01 | 1.51 | 7.75 | -8.34 | 3.3989 | -0.0934 | |||
| IT / Gartner, Inc. | 0.02 | 1.51 | 7.68 | -21.26 | 3.3659 | -0.6601 | |||
| CDNS / Cadence Design Systems, Inc. | 0.02 | 18.92 | 7.38 | 18.96 | 3.2372 | 0.6744 | |||
| KEYS / Keysight Technologies, Inc. | 0.05 | 1.51 | 6.69 | -17.25 | 2.9315 | -0.4050 | |||
| ROP / Roper Technologies, Inc. | 0.01 | 1.50 | 6.05 | -1.24 | 2.6527 | 0.1228 | |||
| ICE / Intercontinental Exchange, Inc. | 0.04 | 1.50 | 6.00 | 6.67 | 2.6307 | 0.3080 | |||
| STE / STERIS plc | 0.03 | 1.51 | 5.98 | 3.39 | 2.6206 | 0.2333 | |||
| HUBS / HubSpot, Inc. | 0.01 | 27.93 | 5.96 | 0.35 | 2.6129 | 0.1606 | |||
| BR / Broadridge Financial Solutions, Inc. | 0.02 | 1.51 | 5.85 | 3.29 | 2.5631 | 0.2259 | |||
| RYAN / Ryan Specialty Holdings, Inc. | 0.08 | 1.51 | 5.55 | -0.13 | 2.4316 | 0.1386 | |||
| WSO / Watsco, Inc. | 0.01 | 1.50 | 4.87 | -2.46 | 2.1350 | 0.0732 | |||
| CSGP / CoStar Group, Inc. | 0.07 | 1.50 | 4.85 | -1.72 | 2.1277 | 0.0888 | |||
| INTU / Intuit Inc. | 0.01 | 1.50 | 4.85 | 5.87 | 2.1268 | 0.2349 | |||
| IDXX / IDEXX Laboratories, Inc. | 0.01 | 1.50 | 4.71 | 4.04 | 2.0668 | 0.1959 | |||
| BURL / Burlington Stores, Inc. | 0.02 | 1.51 | 4.64 | -19.56 | 2.0358 | -0.3475 | |||
| CHD / Church & Dwight Co., Inc. | 0.05 | 1.51 | 4.59 | -4.44 | 2.0115 | 0.0290 | |||
| IEX / IDEX Corporation | 0.03 | 1.50 | 4.52 | -21.27 | 1.9824 | -0.3893 | |||
| POOL / Pool Corporation | 0.02 | 1.50 | 4.51 | -13.56 | 1.9782 | -0.1774 | |||
| WMS / Advanced Drainage Systems, Inc. | 0.04 | 1.51 | 4.50 | -4.72 | 1.9723 | 0.0226 | |||
| MPWR / Monolithic Power Systems, Inc. | 0.01 | 1.50 | 3.57 | -5.55 | 1.5665 | 0.0044 | |||
| VMC / Vulcan Materials Company | 0.01 | 1.50 | 3.46 | -2.87 | 1.5160 | 0.0459 | |||
| ODFL / Old Dominion Freight Line, Inc. | 0.02 | 1.51 | 3.34 | -16.17 | 1.4656 | -0.1811 | |||
| RGEN / Repligen Corporation | 0.02 | 19.94 | 3.33 | -0.42 | 1.4580 | 0.0789 | |||
| HQY / HealthEquity, Inc. | 0.03 | 1.50 | 2.75 | -21.19 | 1.2048 | -0.2353 | |||
| RJF / Raymond James Financial, Inc. | 0.02 | 1.51 | 2.74 | -17.45 | 1.2028 | -0.1693 | |||
| EPAM / EPAM Systems, Inc. | 0.02 | 1.51 | 2.47 | -37.29 | 1.0848 | -0.5443 | |||
| DXCM / DexCom, Inc. | 0.03 | 1.51 | 2.17 | -16.58 | 0.9530 | -0.1227 | |||
| COO / The Cooper Companies, Inc. | 0.03 | 1.50 | 2.14 | -14.14 | 0.9402 | -0.0912 | |||
| ULTA / Ulta Beauty, Inc. | 0.01 | 1.48 | 2.09 | -2.61 | 0.9170 | 0.0304 | |||
| DDOG / Datadog, Inc. | 0.02 | 2.03 | 0.8909 | 0.8909 | |||||
| Treasury Repurchase Agreement / RA (N/A) | 2.00 | 0.8768 | 0.8768 | ||||||
| Treasury Repurchase Agreement / RA (N/A) | 2.00 | 0.8768 | 0.8768 | ||||||
| TRMB / Trimble Inc. | 0.03 | 1.50 | 1.63 | -15.88 | 0.7131 | -0.0851 | |||
| SSNC / SS&C Technologies Holdings, Inc. | 0.02 | 1.51 | 1.58 | -5.22 | 0.6924 | 0.0045 | |||
| BSY / Bentley Systems, Incorporated | 0.03 | 1.51 | 1.41 | -6.25 | 0.6183 | -0.0029 | |||
| FRPT / Freshpet, Inc. | 0.02 | 1.51 | 1.39 | -53.35 | 0.6079 | -0.6189 | |||
| ALGN / Align Technology, Inc. | 0.01 | 1.50 | 1.34 | -19.72 | 0.5872 | -0.1017 | |||
| LULU / lululemon athletica inc. | 0.00 | 1.51 | 1.14 | -33.66 | 0.5014 | -0.2102 | |||
| GPN / Global Payments Inc. | 0.01 | -39.61 | 1.05 | -59.16 | 0.4594 | -0.6002 | |||
| FBHS / Fortune Brands Home & Security Inc | 0.02 | 1.51 | 0.88 | -23.83 | 0.3857 | -0.0909 | |||
| BL / BlackLine, Inc. | 0.01 | 1.50 | 0.69 | -24.89 | 0.3044 | -0.0775 | |||
| GNRC / Generac Holdings Inc. | 0.01 | 1.50 | 0.60 | -22.22 | 0.2641 | -0.0558 | |||
| 0I14 / Cognex Corporation | 0.02 | 1.51 | 0.46 | -30.63 | 0.2029 | -0.0723 | |||
| CRL / Charles River Laboratories International, Inc. | 0.00 | 1.51 | 0.38 | -26.91 | 0.1679 | -0.0485 | |||
| US003CVR0169 / CONTRA ABIOMED INC | 0.02 | 0.00 | 0.00 | 0.0000 | 0.0000 |