Basic Stats
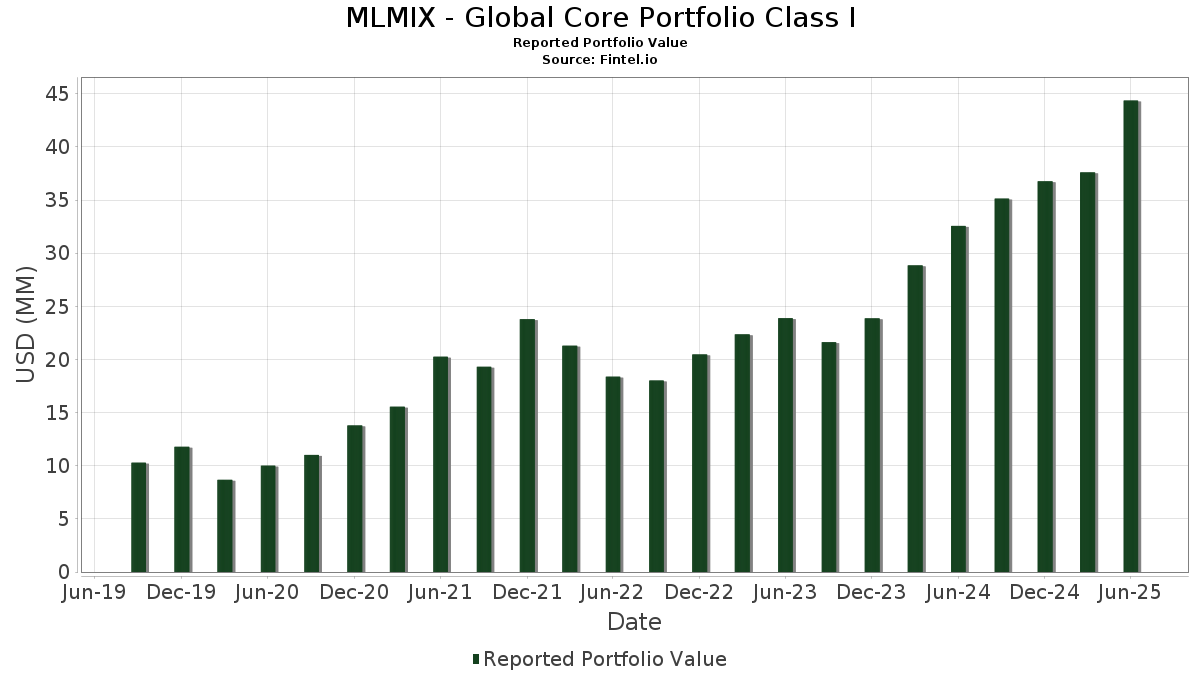
| Portfolio Value | $ 44,363,943 |
| Current Positions | 43 |
Latest Holdings, Performance, AUM (from 13F, 13D)
MLMIX - Global Core Portfolio Class I has disclosed 43 total holdings in their latest SEC filings. Most recent portfolio value is calculated to be $ 44,363,943 USD. Actual Assets Under Management (AUM) is this value plus cash (which is not disclosed). MLMIX - Global Core Portfolio Class I’s top holdings are NVIDIA Corporation (US:NVDA) , Ferrari N.V. (US:RACE) , CRH plc (US:CRH) , JPMorgan Chase & Co. (US:JPM) , and Ameriprise Financial, Inc. (US:AMP) . MLMIX - Global Core Portfolio Class I’s new positions include Cboe Global Markets, Inc. (IT:1CBOE) , General Electric Company (US:GE) , AutoZone, Inc. (US:AZO) , .
Top Increases This Quarter
We use the change in the portfolio allocation because this is the most meaningful metric. Changes can be due to trades or changes in share prices.
| Security | Shares (MM) |
Value (MM$) |
Portfolio % | ΔPortfolio % |
|---|---|---|---|---|
| 0.16 | 1.33 | 3.0039 | 2.5461 | |
| 0.02 | 2.93 | 6.6056 | 1.3719 | |
| 0.00 | 0.54 | 1.2289 | 1.2289 | |
| 0.00 | 1.97 | 4.4384 | 0.9797 | |
| 0.00 | 0.43 | 0.9787 | 0.9787 | |
| 0.00 | 1.89 | 4.2641 | 0.9503 | |
| 0.01 | 2.16 | 4.8797 | 0.9019 | |
| 0.00 | 1.21 | 2.7397 | 0.7722 | |
| 0.11 | 0.59 | 1.3237 | 0.5575 | |
| 0.01 | 2.64 | 5.9592 | 0.3211 |
Top Decreases This Quarter
We use the change in the portfolio allocation because this is the most meaningful metric. Changes can be due to trades or changes in share prices.
| Security | Shares (MM) |
Value (MM$) |
Portfolio % | ΔPortfolio % |
|---|---|---|---|---|
| 0.00 | 0.13 | 0.2975 | -1.5293 | |
| 0.08 | 1.25 | 2.8319 | -1.0937 | |
| 0.01 | 1.91 | 4.3116 | -0.7998 | |
| 0.03 | 2.46 | 5.5506 | -0.7837 | |
| 0.00 | 0.48 | 1.0890 | -0.7033 | |
| 0.01 | 1.10 | 2.4915 | -0.6708 | |
| 0.00 | 0.15 | 0.3472 | -0.5924 | |
| 0.01 | 0.35 | 0.7980 | -0.5791 | |
| 0.01 | 1.50 | 3.3821 | -0.5541 | |
| 0.00 | 0.08 | 0.1859 | -0.5045 |
13F and Fund Filings
This form was filed on 2025-08-22 for the reporting period 2025-06-30. Click the link icon to see the full transaction history.
Upgrade to unlock premium data and export to Excel ![]() .
.
| Security | Type | Avg Share Price | Shares (MM) |
ΔShares (%) |
ΔShares (%) |
Value ($MM) |
Portfolio (%) |
ΔPortfolio (%) |
|
|---|---|---|---|---|---|---|---|---|---|
| NVDA / NVIDIA Corporation | 0.02 | 2.05 | 2.93 | 48.81 | 6.6056 | 1.3719 | |||
| RACE / Ferrari N.V. | 0.01 | 8.62 | 2.64 | 24.59 | 5.9592 | 0.3211 | |||
| CRH / CRH plc | 0.03 | -1.03 | 2.46 | 3.28 | 5.5506 | -0.7837 | |||
| JPM / JPMorgan Chase & Co. | 0.01 | 1.85 | 2.45 | 20.35 | 5.5401 | 0.1155 | |||
| AMP / Ameriprise Financial, Inc. | 0.00 | 13.39 | 2.29 | 24.99 | 5.1720 | 0.2956 | |||
| TSM / Taiwan Semiconductor Manufacturing Company Limited - Depositary Receipt (Common Stock) | 0.01 | 5.97 | 2.16 | 44.62 | 4.8797 | 0.9019 | |||
| MSFT / Microsoft Corporation | 0.00 | 14.15 | 1.97 | 51.23 | 4.4384 | 0.9797 | |||
| AAPL / Apple Inc. | 0.01 | 7.64 | 1.91 | -0.57 | 4.3116 | -0.7998 | |||
| NFLX / Netflix, Inc. | 0.00 | 5.61 | 1.89 | 51.73 | 4.2641 | 0.9503 | |||
| AMZN / Amazon.com, Inc. | 0.01 | -2.37 | 1.74 | 12.58 | 3.9187 | -0.1840 | |||
| TJX / The TJX Companies, Inc. | 0.01 | 6.01 | 1.69 | 7.50 | 3.8177 | -0.3687 | |||
| TCEHY / Tencent Holdings Limited - Depositary Receipt (Common Stock) | 0.02 | 13.59 | 1.60 | 14.75 | 3.6190 | -0.0977 | |||
| PGR / The Progressive Corporation | 0.01 | 7.40 | 1.50 | 1.28 | 3.3821 | -0.5541 | |||
| SAN / Banco Santander, S.A. - Depositary Receipt (Common Stock) | 0.16 | 524.34 | 1.33 | 673.84 | 3.0039 | 2.5461 | |||
| SMFG / Sumitomo Mitsui Financial Group, Inc. - Depositary Receipt (Common Stock) | 0.08 | -13.00 | 1.25 | -14.98 | 2.8319 | -1.0937 | |||
| CBRE / CBRE Group, Inc. | 0.01 | -0.40 | 1.25 | 6.75 | 2.8197 | -0.2947 | |||
| HESAY / Hermès International Société en commandite par actions - Depositary Receipt (Common Stock) | 0.00 | 58.63 | 1.21 | 64.28 | 2.7397 | 0.7722 | |||
| GOOGL / Alphabet Inc. | 0.01 | -11.70 | 1.11 | 0.63 | 2.5087 | -0.4298 | |||
| LPLA / LPL Financial Holdings Inc. | 0.00 | 7.90 | 1.11 | 23.60 | 2.4954 | 0.1173 | |||
| BRO / Brown & Brown, Inc. | 0.01 | 4.20 | 1.10 | -7.07 | 2.4915 | -0.6708 | |||
| MA / Mastercard Incorporated | 0.00 | 7.38 | 0.89 | 10.14 | 2.0113 | -0.1421 | |||
| URI / United Rentals, Inc. | 0.00 | -4.56 | 0.88 | 14.84 | 1.9909 | -0.0544 | |||
| MELI / MercadoLibre, Inc. | 0.00 | 1.66 | 0.80 | 36.16 | 1.8108 | 0.2437 | |||
| WM / Waste Management, Inc. | 0.00 | 7.31 | 0.79 | 6.02 | 1.7882 | -0.1989 | |||
| CVX / Chevron Corporation | 0.00 | 7.15 | 0.59 | -8.27 | 1.3271 | -0.3784 | |||
| MFG / Mizuho Financial Group, Inc. - Depositary Receipt (Common Stock) | 0.11 | 101.79 | 0.59 | 103.47 | 1.3237 | 0.5575 | |||
| 1CBOE / Cboe Global Markets, Inc. | 0.00 | 0.54 | 1.2289 | 1.2289 | |||||
| TYL / Tyler Technologies, Inc. | 0.00 | -29.77 | 0.48 | -28.38 | 1.0890 | -0.7033 | |||
| GE / General Electric Company | 0.00 | 0.43 | 0.9787 | 0.9787 | |||||
| JD / JD.com, Inc. - Depositary Receipt (Common Stock) | 0.01 | -13.95 | 0.35 | -31.72 | 0.7980 | -0.5791 | |||
| NTES / NetEase, Inc. - Depositary Receipt (Common Stock) | 0.00 | 5.16 | 0.34 | 37.75 | 0.7742 | 0.1106 | |||
| COST / Costco Wholesale Corporation | 0.00 | 10.61 | 0.34 | 15.65 | 0.7685 | -0.0139 | |||
| TSLA / Tesla, Inc. | 0.00 | 64.01 | 0.31 | 101.28 | 0.7090 | 0.2933 | |||
| SHOP / Shopify Inc. | 0.00 | 55.98 | 0.28 | 88.59 | 0.6346 | 0.2381 | |||
| EXPGY / Experian plc - Depositary Receipt (Common Stock) | 0.00 | 7.72 | 0.20 | 19.88 | 0.4494 | 0.0052 | |||
| MC / LVMH Moët Hennessy - Louis Vuitton, Société Européenne | 0.00 | -25.92 | 0.19 | -37.62 | 0.4287 | -0.3784 | |||
| VLO / Valero Energy Corporation | 0.00 | 10.16 | 0.16 | 11.89 | 0.3619 | -0.0186 | |||
| MITSY / Mitsui & Co., Ltd. - Depositary Receipt (Common Stock) | 0.00 | -59.35 | 0.15 | -56.66 | 0.3472 | -0.5924 | |||
| LIN / Linde plc | 0.00 | -80.95 | 0.13 | -80.90 | 0.2975 | -1.5293 | |||
| NTTYY / NTT, Inc. - Depositary Receipt (Common Stock) | 0.00 | 11.14 | 0.09 | 23.68 | 0.2121 | 0.0091 | |||
| AZO / AutoZone, Inc. | 0.00 | 0.09 | 0.1927 | 0.1927 | |||||
| MCD / McDonald's Corporation | 0.00 | -66.06 | 0.08 | -68.34 | 0.1859 | -0.5045 | |||
| MRP / Millrose Properties, Inc. | 0.00 | 22.42 | 0.03 | 36.84 | 0.0587 | 0.0061 |