Basic Stats
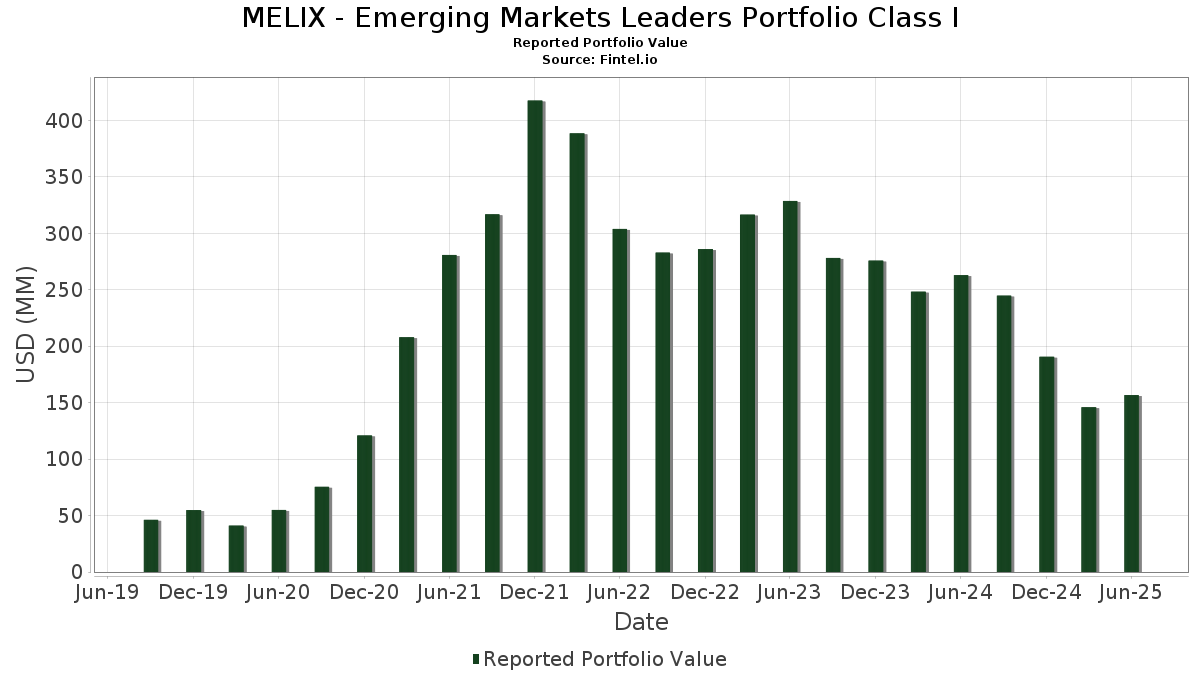
| Portfolio Value | $ 156,683,138 |
| Current Positions | 37 |
Latest Holdings, Performance, AUM (from 13F, 13D)
MELIX - Emerging Markets Leaders Portfolio Class I has disclosed 37 total holdings in their latest SEC filings. Most recent portfolio value is calculated to be $ 156,683,138 USD. Actual Assets Under Management (AUM) is this value plus cash (which is not disclosed). MELIX - Emerging Markets Leaders Portfolio Class I’s top holdings are Taiwan Semiconductor Manufacturing Company Limited (TW:2330) , MercadoLibre, Inc. (US:MELI) , Localiza Rent a Car S.A. (BR:RENT3) , Grupo Financiero Banorte, S.A.B. de C.V. (DE:4FN) , and HDFC Bank Ltd (IN:HDFCB) . MELIX - Emerging Markets Leaders Portfolio Class I’s new positions include XP Inc. (US:XP) , Samvardhana Motherson International Limited (IN:MOTHERSON) , Optima bank SA (GR:GRS533003000) , .
Top Increases This Quarter
We use the change in the portfolio allocation because this is the most meaningful metric. Changes can be due to trades or changes in share prices.
| Security | Shares (MM) |
Value (MM$) |
Portfolio % | ΔPortfolio % |
|---|---|---|---|---|
| 0.31 | 6.17 | 3.9641 | 3.9641 | |
| 2.13 | 3.84 | 2.4700 | 2.4700 | |
| 0.00 | 10.72 | 6.8868 | 2.0392 | |
| 1.31 | 9.75 | 6.2639 | 1.4048 | |
| 0.19 | 1.82 | 1.1683 | 1.1683 | |
| 0.91 | 8.37 | 5.3782 | 0.8926 | |
| 0.03 | 4.84 | 3.1127 | 0.8029 | |
| 0.44 | 3.42 | 2.1999 | 0.7122 | |
| 0.16 | 7.13 | 4.5804 | 0.6967 | |
| 0.06 | 4.91 | 3.1553 | 0.6850 |
Top Decreases This Quarter
We use the change in the portfolio allocation because this is the most meaningful metric. Changes can be due to trades or changes in share prices.
| Security | Shares (MM) |
Value (MM$) |
Portfolio % | ΔPortfolio % |
|---|---|---|---|---|
| 2.95 | 2.95 | 1.8979 | -3.9634 | |
| 0.00 | 0.32 | 0.2066 | -2.7920 | |
| 0.03 | 0.41 | 0.2620 | -2.3401 | |
| 0.07 | 2.24 | 1.4375 | -2.0111 | |
| 0.01 | 0.62 | 0.3996 | -1.8718 | |
| 0.00 | 0.23 | 0.1486 | -1.8417 | |
| 0.06 | 2.78 | 1.7830 | -1.3185 | |
| 1.27 | 6.78 | 4.3592 | -0.9758 | |
| 0.45 | 7.67 | 4.9287 | -0.6828 | |
| 0.35 | 8.21 | 5.2754 | -0.6510 |
13F and Fund Filings
This form was filed on 2025-08-22 for the reporting period 2025-06-30. Click the link icon to see the full transaction history.
Upgrade to unlock premium data and export to Excel ![]() .
.
| Security | Type | Avg Share Price | Shares (MM) |
ΔShares (%) |
ΔShares (%) |
Value ($MM) |
Portfolio (%) |
ΔPortfolio (%) |
|
|---|---|---|---|---|---|---|---|---|---|
| 2330 / Taiwan Semiconductor Manufacturing Company Limited | 0.33 | -18.02 | 12.14 | 6.44 | 7.8008 | -0.0523 | |||
| MELI / MercadoLibre, Inc. | 0.00 | 13.63 | 10.72 | 52.24 | 6.8868 | 2.0392 | |||
| RENT3 / Localiza Rent a Car S.A. | 1.31 | 9.03 | 9.75 | 38.15 | 6.2639 | 1.4048 | |||
| 4FN / Grupo Financiero Banorte, S.A.B. de C.V. | 0.91 | -2.89 | 8.37 | 28.47 | 5.3782 | 0.8926 | |||
| HDFCB / HDFC Bank Ltd | 0.35 | -12.91 | 8.21 | -4.61 | 5.2754 | -0.6510 | |||
| ICICIBANK / ICICI Bank Limited | 0.45 | -12.46 | 7.67 | -5.88 | 4.9287 | -0.6828 | |||
| BHARTIARTL / Bharti Airtel Limited | 0.33 | -4.21 | 7.63 | 11.08 | 4.9041 | 0.1733 | |||
| KEI / KEI Industries Limited | 0.16 | -3.82 | 7.13 | 26.38 | 4.5804 | 0.6967 | |||
| VBL / Varun Beverages Limited | 1.27 | 3.25 | 6.78 | -12.44 | 4.3592 | -0.9758 | |||
| CPNG / Coupang, Inc. | 0.21 | -6.53 | 6.17 | 27.68 | 3.9661 | 0.6378 | |||
| XP / XP Inc. | 0.31 | 6.17 | 3.9641 | 3.9641 | |||||
| RADL3 / Raia Drogasil S.A. | 1.92 | 49.82 | 5.33 | 24.88 | 3.4258 | 0.4866 | |||
| TITAN / Titan Company Limited | 0.12 | -0.43 | 5.26 | 20.08 | 3.3771 | 0.3633 | |||
| 8069 / E Ink Holdings Inc. | 0.67 | 19.79 | 5.09 | 11.39 | 3.2680 | 0.1236 | |||
| 532488 / Divi's Laboratories Limited | 0.06 | 16.09 | 4.91 | 36.88 | 3.1553 | 0.6850 | |||
| SE / Sea Limited - Depositary Receipt (Common Stock) | 0.03 | -71.20 | 4.84 | -31.10 | 3.1127 | 0.8029 | |||
| AMBUJACEM / Ambuja Cements Limited | 0.65 | -0.67 | 4.37 | 6.76 | 2.8106 | -0.0105 | |||
| OBEROI / Oberoi Realty Ltd | 0.18 | -1.66 | 3.94 | 14.79 | 2.5332 | 0.1687 | |||
| MOTHERSON / Samvardhana Motherson International Limited | 2.13 | 3.84 | 2.4700 | 2.4700 | |||||
| BPAC11 / Banco BTG Pactual S.A. - Debt/Equity Composite Units | 0.44 | 20.34 | 3.42 | 58.47 | 2.1999 | 0.7122 | |||
| 532830 / Astral Limited | 0.19 | -16.22 | 3.41 | -2.55 | 2.1902 | -0.2175 | |||
| US61747C7074 / Morgan Stanley Institutional Liquidity Funds Government Portfolio, Institutional Class | 2.95 | -65.30 | 2.95 | -65.31 | 1.8979 | -3.9634 | |||
| WEGE3 / WEG S.A. | 0.37 | -4.39 | 2.90 | -5.13 | 1.8648 | -0.2414 | |||
| 6409 / Voltronic Power Technology Corp. | 0.06 | -33.22 | 2.78 | -38.39 | 1.7830 | -1.3185 | |||
| ZOMATO / Eternal Limited | 0.75 | 30.14 | 2.30 | 70.60 | 1.4771 | 0.5494 | |||
| TVSMOTOR / TVS Motor Company Limited | 0.07 | -63.00 | 2.24 | -55.33 | 1.4375 | -2.0111 | |||
| 522113 / Timken India Limited | 0.05 | -4.32 | 1.92 | 21.84 | 1.2334 | 0.1484 | |||
| AUBANK / AU Small Finance Bank Limited | 0.19 | 1.82 | 1.1683 | 1.1683 | |||||
| INE474Q01031 / Global Health Ltd | 0.12 | -2.45 | 1.63 | -7.35 | 1.0456 | -0.1640 | |||
| AEE01135A222 / Americana Restaurants International plc | 1.03 | -4.39 | 0.63 | 1.28 | 0.4074 | -0.0240 | |||
| GLOB / Globant S.A. | 0.01 | -75.57 | 0.62 | -81.17 | 0.3996 | -1.8718 | |||
| GRS533003000 / Optima bank SA | 0.02 | 0.48 | 0.3114 | 0.3114 | |||||
| M1Z / Nu Holdings Ltd. | 0.03 | -91.95 | 0.41 | -89.23 | 0.2620 | -2.3401 | |||
| FMX / Fomento Económico Mexicano, S.A.B. de C.V. - Depositary Receipt (Common Stock) | 0.00 | -93.01 | 0.32 | -92.63 | 0.2066 | -2.7920 | |||
| HDB / HDFC Bank Limited - Depositary Receipt (Common Stock) | 0.00 | -93.07 | 0.23 | -92.01 | 0.1486 | -1.8417 | |||
| LAURUS / Laurus Labs Ltd | 0.02 | -4.02 | 0.19 | 46.83 | 0.1192 | 0.0664 | |||
| CHOLAFIN / Cholamandalam Investment and Finance Company Limited | 0.00 | -17.72 | 0.09 | -11.76 | 0.0580 | -0.0124 |