Basic Stats
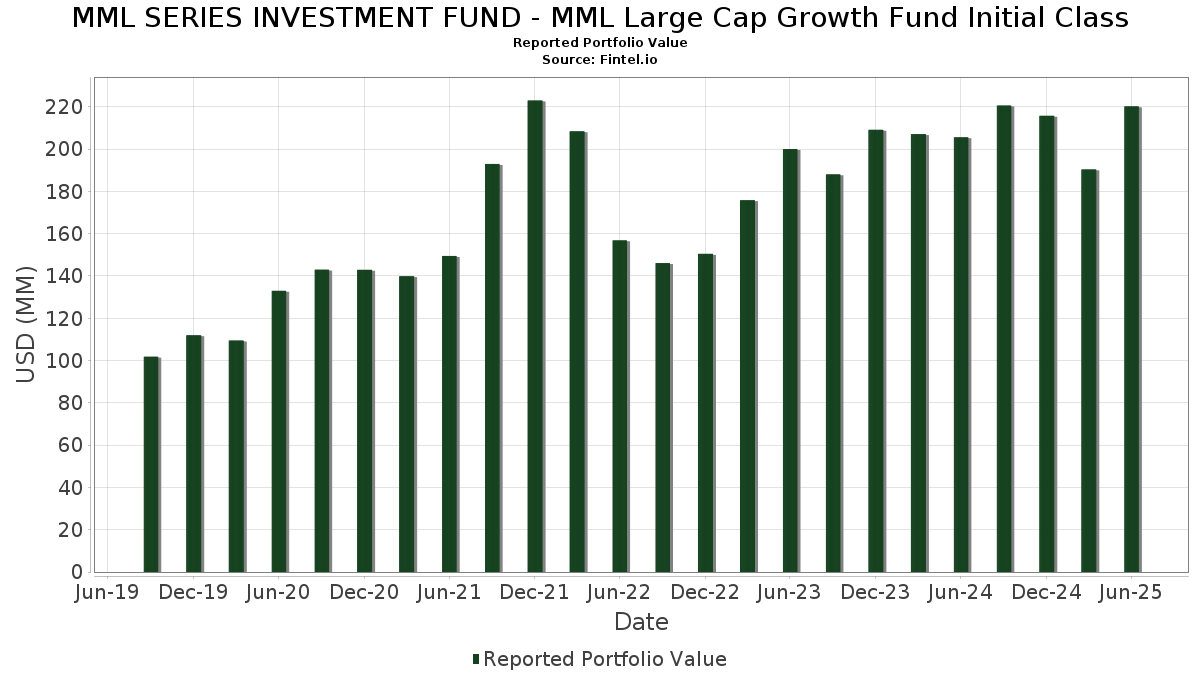
| Portfolio Value | $ 220,190,899 |
| Current Positions | 39 |
Latest Holdings, Performance, AUM (from 13F, 13D)
MML SERIES INVESTMENT FUND - MML Large Cap Growth Fund Initial Class has disclosed 39 total holdings in their latest SEC filings. Most recent portfolio value is calculated to be $ 220,190,899 USD. Actual Assets Under Management (AUM) is this value plus cash (which is not disclosed). MML SERIES INVESTMENT FUND - MML Large Cap Growth Fund Initial Class’s top holdings are NVIDIA Corporation (US:NVDA) , Meta Platforms, Inc. (US:META) , Netflix, Inc. (US:NFLX) , Tesla, Inc. (US:TSLA) , and Amazon.com, Inc. (US:AMZN) . MML SERIES INVESTMENT FUND - MML Large Cap Growth Fund Initial Class’s new positions include State Street Navigator Securities Lending Government Money Market Portfolio (US:US8575093013) , .
Top Increases This Quarter
We use the change in the portfolio allocation because this is the most meaningful metric. Changes can be due to trades or changes in share prices.
| Security | Shares (MM) |
Value (MM$) |
Portfolio % | ΔPortfolio % |
|---|---|---|---|---|
| 0.14 | 22.05 | 10.0917 | 1.8313 | |
| 0.01 | 17.56 | 8.0373 | 1.3563 | |
| 0.06 | 12.26 | 5.6138 | 1.3295 | |
| 2.83 | 1.2942 | 1.2942 | ||
| 1.79 | 1.79 | 0.8172 | 0.8172 | |
| 0.03 | 18.56 | 8.4973 | 0.5782 | |
| 0.02 | 10.17 | 4.6534 | 0.5080 | |
| 0.05 | 10.39 | 4.7538 | 0.1867 | |
| 0.04 | 14.06 | 6.4372 | 0.1781 | |
| 0.05 | 5.98 | 2.7393 | 0.1660 |
Top Decreases This Quarter
We use the change in the portfolio allocation because this is the most meaningful metric. Changes can be due to trades or changes in share prices.
| Security | Shares (MM) |
Value (MM$) |
Portfolio % | ΔPortfolio % |
|---|---|---|---|---|
| 0.03 | 10.88 | 4.9781 | -1.0467 | |
| 0.01 | 5.74 | 2.6286 | -0.7482 | |
| 0.01 | 0.86 | 0.3925 | -0.5414 | |
| 0.02 | 5.24 | 2.3997 | -0.3870 | |
| 0.00 | 2.03 | 0.9274 | -0.3752 | |
| 0.03 | 2.93 | 1.3431 | -0.3539 | |
| 0.01 | 3.42 | 1.5668 | -0.3311 | |
| 0.04 | 2.97 | 1.3596 | -0.2637 | |
| 0.02 | 2.44 | 1.1157 | -0.2558 | |
| 0.09 | 5.38 | 2.4632 | -0.2525 |
13F and Fund Filings
This form was filed on 2025-08-25 for the reporting period 2025-06-30. Click the link icon to see the full transaction history.
Upgrade to unlock premium data and export to Excel ![]() .
.
| Security | Type | Avg Share Price | Shares (MM) |
ΔShares (%) |
ΔShares (%) |
Value ($MM) |
Portfolio (%) |
ΔPortfolio (%) |
|
|---|---|---|---|---|---|---|---|---|---|
| NVDA / NVIDIA Corporation | 0.14 | -3.21 | 22.05 | 41.09 | 10.0917 | 1.8313 | |||
| META / Meta Platforms, Inc. | 0.03 | -3.24 | 18.56 | 23.92 | 8.4973 | 0.5782 | |||
| NFLX / Netflix, Inc. | 0.01 | -3.25 | 17.56 | 38.93 | 8.0373 | 1.3563 | |||
| TSLA / Tesla, Inc. | 0.04 | -3.10 | 14.06 | 18.78 | 6.4372 | 0.1781 | |||
| AMZN / Amazon.com, Inc. | 0.06 | -3.23 | 12.89 | 11.60 | 5.8991 | -0.2058 | |||
| ORCL / Oracle Corporation | 0.06 | -3.23 | 12.26 | 51.33 | 5.6138 | 1.3295 | |||
| V / Visa Inc. | 0.03 | -5.81 | 10.88 | -4.58 | 4.9781 | -1.0467 | |||
| GOOGL / Alphabet Inc. | 0.06 | 0.71 | 10.44 | 14.76 | 4.7786 | -0.0298 | |||
| BA / The Boeing Company | 0.05 | -2.16 | 10.39 | 20.21 | 4.7538 | 0.1867 | |||
| MSFT / Microsoft Corporation | 0.02 | -2.16 | 10.17 | 29.65 | 4.6534 | 0.5080 | |||
| DIS / The Walt Disney Company | 0.05 | -2.16 | 5.98 | 22.95 | 2.7393 | 0.1660 | |||
| ADSK / Autodesk, Inc. | 0.02 | -2.16 | 5.93 | 15.69 | 2.7134 | 0.0048 | |||
| VRTX / Vertex Pharmaceuticals Incorporated | 0.01 | -2.10 | 5.74 | -10.10 | 2.6286 | -0.7482 | |||
| SHOP / Shopify Inc. | 0.05 | -2.15 | 5.38 | 18.33 | 2.4640 | 0.0592 | |||
| MNST / Monster Beverage Corporation | 0.09 | -2.14 | 5.38 | 4.75 | 2.4632 | -0.2525 | |||
| CRM / Salesforce, Inc. | 0.02 | -2.13 | 5.24 | -0.55 | 2.3997 | -0.3870 | |||
| REGN / Regeneron Pharmaceuticals, Inc. | 0.01 | 15.17 | 3.42 | -4.65 | 1.5668 | -0.3311 | |||
| ISRG / Intuitive Surgical, Inc. | 0.01 | -2.14 | 3.15 | 7.40 | 1.4419 | -0.1090 | |||
| NVO / Novo Nordisk A/S - Depositary Receipt (Common Stock) | 0.04 | -2.68 | 2.97 | -3.26 | 1.3596 | -0.2637 | |||
| SBUX / Starbucks Corporation | 0.03 | -2.15 | 2.93 | -8.60 | 1.3431 | -0.3539 | |||
| FIXED INC CLEARING CORP.REPO / RA (000000000) | 2.83 | 1.2942 | 1.2942 | ||||||
| SEIC / SEI Investments Company | 0.03 | -2.16 | 2.56 | 13.22 | 1.1722 | -0.0231 | |||
| QCOM / QUALCOMM Incorporated | 0.02 | -9.39 | 2.44 | -6.05 | 1.1157 | -0.2558 | |||
| DE / Deere & Company | 0.00 | 19.76 | 2.31 | 29.81 | 1.0565 | 0.1161 | |||
| NVS / Novartis AG - Depositary Receipt (Common Stock) | 0.02 | -2.16 | 2.30 | 6.20 | 1.0518 | -0.0919 | |||
| FDS / FactSet Research Systems Inc. | 0.01 | -2.17 | 2.24 | -3.78 | 1.0243 | -0.2048 | |||
| EXPD / Expeditors International of Washington, Inc. | 0.02 | -2.16 | 2.17 | -7.03 | 0.9930 | -0.2406 | |||
| TMO / Thermo Fisher Scientific Inc. | 0.00 | 0.91 | 2.03 | -17.78 | 0.9274 | -0.3752 | |||
| YUM / Yum! Brands, Inc. | 0.01 | -2.16 | 1.95 | -7.86 | 0.8913 | -0.2259 | |||
| US8575093013 / State Street Navigator Securities Lending Government Money Market Portfolio | 1.79 | 1.79 | 0.8172 | 0.8172 | |||||
| RHHBY / Roche Holding AG - Depositary Receipt (Common Stock) | 0.04 | -2.16 | 1.76 | -3.08 | 0.8059 | -0.1544 | |||
| NKE / NIKE, Inc. | 0.02 | -2.17 | 1.65 | 9.50 | 0.7547 | -0.0414 | |||
| XYZ / Block, Inc. | 0.02 | -2.20 | 1.64 | 22.31 | 0.7505 | 0.0417 | |||
| PYPL / PayPal Holdings, Inc. | 0.02 | -2.15 | 1.63 | 11.45 | 0.7447 | -0.0269 | |||
| WDAY / Workday, Inc. | 0.01 | -2.14 | 1.60 | 0.57 | 0.7330 | -0.1087 | |||
| ILMN / Illumina, Inc. | 0.01 | -2.14 | 1.35 | 17.76 | 0.6162 | 0.0115 | |||
| GOOG / Alphabet Inc. | 0.01 | -27.92 | 1.19 | -18.19 | 0.5438 | -0.2235 | |||
| BABA / Alibaba Group Holding Limited - Depositary Receipt (Common Stock) | 0.01 | -43.41 | 0.86 | -51.47 | 0.3925 | -0.5414 | |||
| YUMC / Yum China Holdings, Inc. | 0.01 | -23.97 | 0.53 | -34.72 | 0.2445 | -0.1879 |