Basic Stats
| Portfolio Value | $ 94,030,000 |
| Current Positions | 31 |
Latest Holdings, Performance, AUM (from 13F, 13D)
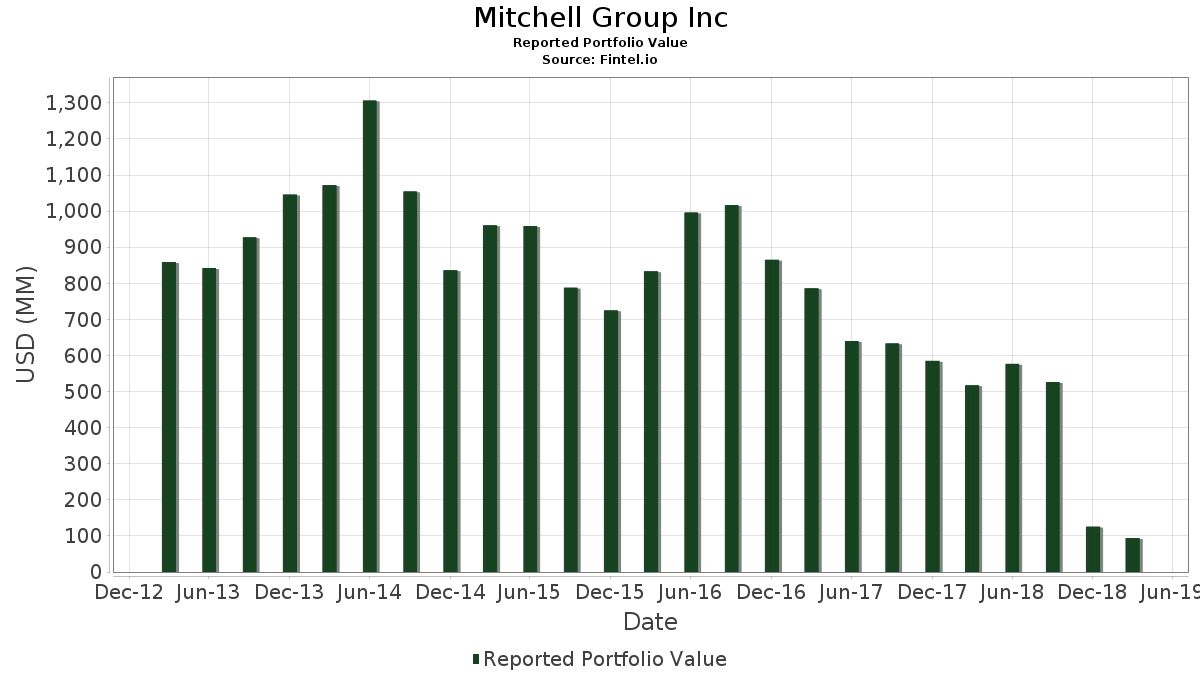
Mitchell Group Inc has disclosed 31 total holdings in their latest SEC filings. Most recent portfolio value is calculated to be $ 94,030,000 USD. Actual Assets Under Management (AUM) is this value plus cash (which is not disclosed). Mitchell Group Inc’s top holdings are Devon Energy Corporation (US:DVN) , Kinder Morgan, Inc. (US:KMI) , Marathon Oil Corporation (US:MRO) , Diamondback Energy, Inc. (US:FANG) , and Occidental Petroleum Corporation (US:OXY) .
Top Increases This Quarter
We use the change in the portfolio allocation because this is the most meaningful metric. Changes can be due to trades or changes in share prices.
| Security | Shares (MM) |
Value (MM$) |
Portfolio % | ΔPortfolio % |
|---|---|---|---|---|
| 0.15 | 3.79 | 4.0317 | 4.0317 | |
| 0.18 | 3.49 | 3.7073 | 3.7073 | |
| 0.14 | 3.11 | 3.3106 | 3.3106 | |
| 0.07 | 3.35 | 3.5659 | 2.9459 | |
| 0.18 | 2.50 | 2.6619 | 2.6619 | |
| 0.19 | 1.66 | 1.7696 | 1.7696 | |
| 0.07 | 1.61 | 1.7175 | 1.7175 | |
| 0.16 | 5.11 | 5.4387 | 1.4415 | |
| 0.13 | 3.17 | 3.3734 | 1.2385 | |
| 0.23 | 4.61 | 4.9016 | 1.1148 |
Top Decreases This Quarter
We use the change in the portfolio allocation because this is the most meaningful metric. Changes can be due to trades or changes in share prices.
| Security | Shares (MM) |
Value (MM$) |
Portfolio % | ΔPortfolio % |
|---|---|---|---|---|
| 0.05 | 3.42 | 3.6339 | -4.0178 | |
| 0.00 | 0.00 | -2.5708 | ||
| 0.08 | 3.64 | 3.8754 | -0.8423 | |
| 0.02 | 3.50 | 3.7169 | -0.8119 | |
| 0.00 | 0.00 | -0.8073 | ||
| 0.00 | 0.00 | -0.6176 | ||
| 0.29 | 3.82 | 4.0636 | -0.6126 | |
| 0.00 | 0.00 | -0.5953 | ||
| 0.00 | 0.00 | -0.5897 | ||
| 0.00 | 0.00 | -0.5817 |
13F and Fund Filings
This form was filed on 2019-05-02 for the reporting period 2019-03-31. Click the link icon to see the full transaction history.
Upgrade to unlock premium data and export to Excel ![]() .
.
| Security | Type | Avg Share Price | Shares (MM) |
ΔShares (%) |
ΔShares (%) |
Value ($MM) |
Portfolio (%) |
ΔPortfolio (%) |
|
|---|---|---|---|---|---|---|---|---|---|
| DVN / Devon Energy Corporation | 0.16 | -27.19 | 5.11 | 1.95 | 5.4387 | 1.4415 | |||
| KMI / Kinder Morgan, Inc. | 0.23 | -25.47 | 4.61 | -3.01 | 4.9016 | 1.1148 | |||
| MRO / Marathon Oil Corporation | 0.26 | -30.76 | 4.39 | -19.30 | 4.6730 | 0.3339 | |||
| FANG / Diamondback Energy, Inc. | 0.04 | -26.73 | 4.18 | -19.75 | 4.4507 | 0.2949 | |||
| OXY / Occidental Petroleum Corporation | 0.06 | -27.93 | 3.94 | -22.25 | 4.1955 | 0.1520 | |||
| US98212B1035 / WPX Energy, Inc. | 0.29 | -43.63 | 3.82 | -34.88 | 4.0636 | -0.6126 | |||
| PAGP / Plains GP Holdings, L.P. - Limited Partnership | 0.15 | -27.39 | 3.79 | -9.97 | 4.0317 | 4.0317 | |||
| XEC / Cimarex Energy Co. | 0.05 | -26.90 | 3.67 | -17.11 | 3.9009 | 0.3746 | |||
| HAL / Halliburton Company | 0.12 | -27.49 | 3.66 | -20.08 | 3.8892 | 0.2426 | |||
| US0325111070 / Anadarko Petroleum Corp. | 0.08 | -40.67 | 3.64 | -38.45 | 3.8754 | -0.8423 | |||
| PXD / Pioneer Natural Resources Company | 0.02 | -46.89 | 3.50 | -38.50 | 3.7169 | -0.8119 | |||
| US7018771029 / Parsley Energy, Inc. | 0.18 | -27.74 | 3.49 | -12.74 | 3.7073 | 3.7073 | |||
| COG / Cabot Oil & Gas Corp. | 0.13 | -44.10 | 3.45 | -34.72 | 3.6680 | -0.5420 | |||
| RDS.A / Shell Plc - ADR (Representing Ordinary Shares - Class A) | 0.05 | -66.86 | 3.42 | -64.41 | 3.6339 | -4.0178 | |||
| CLR / Continental Resources Inc (OKLA) | 0.07 | 286.60 | 3.35 | 330.98 | 3.5659 | 2.9459 | |||
| HES / Hess Corporation | 0.05 | -41.55 | 3.24 | -13.06 | 3.4478 | 0.4762 | |||
| FTI / TechnipFMC plc | 0.13 | -1.42 | 3.17 | 18.40 | 3.3734 | 1.2385 | |||
| PUMP / ProPetro Holding Corp. | 0.14 | -54.76 | 3.11 | -17.23 | 3.3106 | 3.3106 | |||
| US6550441058 / Noble Energy, Inc. | 0.12 | -27.64 | 3.09 | -4.61 | 3.2819 | 0.7040 | |||
| PTEN / Patterson-UTI Energy, Inc. | 0.18 | -27.49 | 2.50 | -1.77 | 2.6619 | 2.6619 | |||
| XOM / Exxon Mobil Corporation | 0.03 | -27.35 | 2.37 | -13.91 | 2.5152 | 0.3261 | |||
| SLB / Schlumberger Limited | 0.05 | -27.24 | 2.34 | -12.13 | 2.4875 | 0.3662 | |||
| MPC / Marathon Petroleum Corporation | 0.04 | -27.18 | 2.26 | -26.14 | 2.4067 | -0.0350 | |||
| VLO / Valero Energy Corporation | 0.03 | -27.28 | 2.19 | -17.71 | 2.3280 | 0.2082 | |||
| RRC / Range Resources Corporation | 0.19 | -29.03 | 2.09 | -16.64 | 2.2269 | 0.2251 | |||
| SPNV / Supernova Partners Acquisition Company Inc - Class A | 0.43 | -27.80 | 2.01 | 0.65 | 2.1344 | 0.5454 | |||
| EQT / EQT Corporation | 0.09 | -26.88 | 1.92 | -19.71 | 2.0451 | 0.1365 | |||
| NBR / Nabors Industries Ltd. | 0.51 | -27.50 | 1.75 | 24.70 | 1.8632 | 0.7436 | |||
| RIG / Transocean Ltd. | 0.19 | -27.46 | 1.66 | -8.92 | 1.7696 | 1.7696 | |||
| ETRN / Equitrans Midstream Corporation | 0.07 | -28.13 | 1.61 | -21.83 | 1.7175 | 1.7175 | |||
| WFT / Weatherford International plc | 0.97 | -28.47 | 0.68 | -10.60 | 0.7179 | 0.1162 | |||
| NFX / Newfield Exploration Company | 0.00 | -100.00 | 0.00 | -100.00 | -2.5708 | ||||
| WMB / The Williams Companies, Inc. | 0.00 | -100.00 | 0.00 | -100.00 | -0.6176 | ||||
| EOG / EOG Resources, Inc. | 0.00 | -100.00 | 0.00 | -100.00 | -0.5777 | ||||
| OKE / ONEOK, Inc. | 0.00 | -100.00 | 0.00 | -100.00 | -0.5953 | ||||
| IYE / iShares Trust - iShares U.S. Energy ETF | 0.00 | -100.00 | 0.00 | 0.0000 | |||||
| TRGP / Targa Resources Corp. | 0.00 | -100.00 | 0.00 | -100.00 | 0.0000 | ||||
| XOP / SPDR Series Trust - SPDR S&P Oil & Gas Exploration & Production ETF | 0.00 | -100.00 | 0.00 | 0.0000 | |||||
| XES / SPDR Series Trust - SPDR S&P Oil & Gas Equipment & Services ETF | 0.00 | -100.00 | 0.00 | 0.0000 | |||||
| US20605P1012 / Concho Resources, Inc. | 0.00 | -100.00 | 0.00 | -100.00 | -0.5817 | ||||
| FET / Forum Energy Technologies, Inc. | 0.00 | -100.00 | 0.00 | -100.00 | -0.8073 | ||||
| PSX / Phillips 66 | 0.00 | -100.00 | 0.00 | -100.00 | -0.5897 | ||||
| COP / ConocoPhillips | 0.00 | -100.00 | 0.00 | -100.00 | -0.2941 | ||||
| CVX / Chevron Corporation | 0.00 | -100.00 | 0.00 | -100.00 | -0.4232 |