Basic Stats
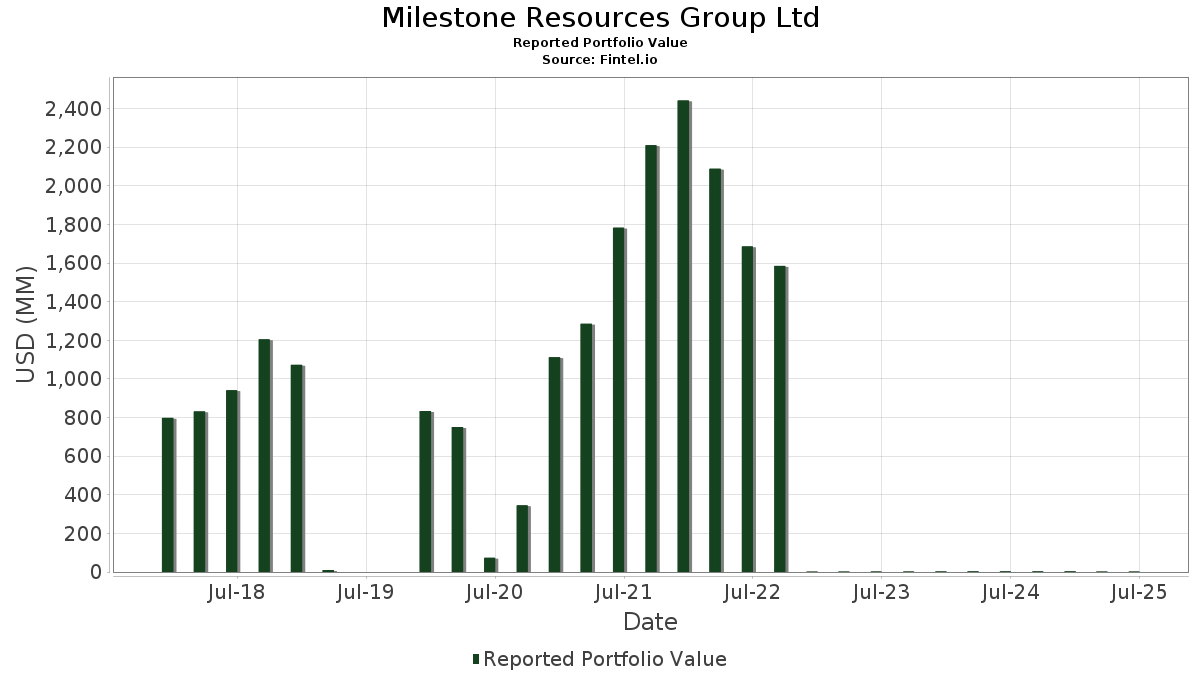
| Portfolio Value | $ 1,915,708 |
| Current Positions | 13 |
Latest Holdings, Performance, AUM (from 13F, 13D)
Milestone Resources Group Ltd has disclosed 13 total holdings in their latest SEC filings. Most recent portfolio value is calculated to be $ 1,915,708 USD. Actual Assets Under Management (AUM) is this value plus cash (which is not disclosed). Milestone Resources Group Ltd’s top holdings are Microsoft Corporation (US:MSFT) , Amazon.com, Inc. (US:AMZN) , ICICI Bank Limited - Depositary Receipt (Common Stock) (US:IBN) , S&P Global Inc. (US:SPGI) , and Broadcom Inc. (US:AVGO) . Milestone Resources Group Ltd’s new positions include HDFC Bank Limited - Depositary Receipt (Common Stock) (US:HDB) , .
Top Increases This Quarter
We use the change in the portfolio allocation because this is the most meaningful metric. Changes can be due to trades or changes in share prices.
| Security | Shares (MM) |
Value (MM$) |
Portfolio % | ΔPortfolio % |
|---|---|---|---|---|
| 0.84 | 0.42 | 21.8157 | 10.5012 | |
| 0.44 | 0.23 | 12.0749 | 5.2310 | |
| 0.74 | 0.20 | 10.6365 | 4.2295 | |
| 7.83 | 0.26 | 13.7523 | 2.9094 | |
| 0.68 | 0.05 | 2.7400 | 2.7400 | |
| 0.17 | 0.14 | 7.0759 | 1.7990 | |
| 1.46 | 0.32 | 16.7488 | 0.6229 | |
| 0.19 | 0.02 | 0.9883 | 0.1432 | |
| 0.01 | 0.01 | 0.5905 | 0.0950 | |
| 0.00 | 0.00 | 0.0147 | 0.0035 |
Top Decreases This Quarter
We use the change in the portfolio allocation because this is the most meaningful metric. Changes can be due to trades or changes in share prices.
| Security | Shares (MM) |
Value (MM$) |
Portfolio % | ΔPortfolio % |
|---|---|---|---|---|
| 0.00 | 0.00 | -5.5171 | ||
| 0.40 | 0.14 | 7.0938 | -0.2502 | |
| 0.91 | 0.12 | 6.4559 | -0.1527 | |
| 0.00 | 0.00 | -0.1352 | ||
| 0.00 | 0.00 | 0.0000 | -0.0143 |
13F and Fund Filings
This form was filed on 2025-08-08 for the reporting period 2025-06-30. Click the link icon to see the full transaction history.
Upgrade to unlock premium data and export to Excel ![]() .
.
| Security | Type | Avg Share Price | Shares (MM) |
ΔShares (%) |
ΔShares (%) |
Value ($MM) |
Portfolio (%) |
ΔPortfolio (%) |
|
|---|---|---|---|---|---|---|---|---|---|
| MSFT / Microsoft Corporation | 0.84 | 47.67 | 0.42 | 95.77 | 21.8157 | 10.5012 | |||
| AMZN / Amazon.com, Inc. | 1.46 | -8.59 | 0.32 | 5.26 | 16.7488 | 0.6229 | |||
| IBN / ICICI Bank Limited - Depositary Receipt (Common Stock) | 7.83 | 20.60 | 0.26 | 28.92 | 13.7523 | 2.9094 | |||
| SPGI / S&P Global Inc. | 0.44 | 72.53 | 0.23 | 79.07 | 12.0749 | 5.2310 | |||
| AVGO / Broadcom Inc. | 0.74 | 2.33 | 0.20 | 69.17 | 10.6365 | 4.2295 | |||
| SHW / The Sherwin-Williams Company | 0.40 | -0.31 | 0.14 | -2.17 | 7.0938 | -0.2502 | |||
| INTU / Intuit Inc. | 0.17 | 6.08 | 0.14 | 36.36 | 7.0759 | 1.7990 | |||
| ABT / Abbott Laboratories | 0.91 | -3.31 | 0.12 | -0.81 | 6.4559 | -0.1527 | |||
| HDB / HDFC Bank Limited - Depositary Receipt (Common Stock) | 0.68 | 0.05 | 2.7400 | 2.7400 | |||||
| SN / SharkNinja, Inc. | 0.19 | 0.00 | 0.02 | 20.00 | 0.9883 | 0.1432 | |||
| ASML / ASML Holding N.V. - Depositary Receipt (Common Stock) | 0.01 | 0.00 | 0.01 | 22.22 | 0.5905 | 0.0950 | |||
| LRCX / Lam Research Corporation | 0.00 | 0.00 | 0.00 | 0.0147 | 0.0035 | ||||
| AMAT / Applied Materials, Inc. | 0.00 | 0.00 | 0.00 | 0.0127 | 0.0025 | ||||
| META / Meta Platforms, Inc. | 0.00 | -100.00 | 0.00 | -100.00 | -5.5171 | ||||
| ZTS / Zoetis Inc. | 0.00 | -100.00 | 0.00 | 0.0000 | |||||
| UNH / UnitedHealth Group Incorporated | 0.00 | -100.00 | 0.00 | 0.0000 | |||||
| NVDA / NVIDIA Corporation | 0.00 | -100.00 | 0.00 | 0.0000 | -0.0143 | ||||
| V / Visa Inc. | 0.00 | -100.00 | 0.00 | 0.0000 | |||||
| TMO / Thermo Fisher Scientific Inc. | 0.00 | -100.00 | 0.00 | 0.0000 | |||||
| TSLA / Tesla, Inc. | 0.00 | -100.00 | 0.00 | -100.00 | -0.1352 | ||||
| CRM / Salesforce, Inc. | 0.00 | -100.00 | 0.00 | 0.0000 | |||||
| MA / Mastercard Incorporated | 0.00 | -100.00 | 0.00 | 0.0000 |